Immigrants from North Macedonia vs Immigrants from Hong Kong Disability Age Over 75
COMPARE
Immigrants from North Macedonia
Immigrants from Hong Kong
Disability Age Over 75
Disability Age Over 75 Comparison
Immigrants from North Macedonia
Immigrants from Hong Kong
45.9%
DISABILITY AGE OVER 75
99.5/ 100
METRIC RATING
64th/ 347
METRIC RANK
46.5%
DISABILITY AGE OVER 75
96.4/ 100
METRIC RATING
110th/ 347
METRIC RANK
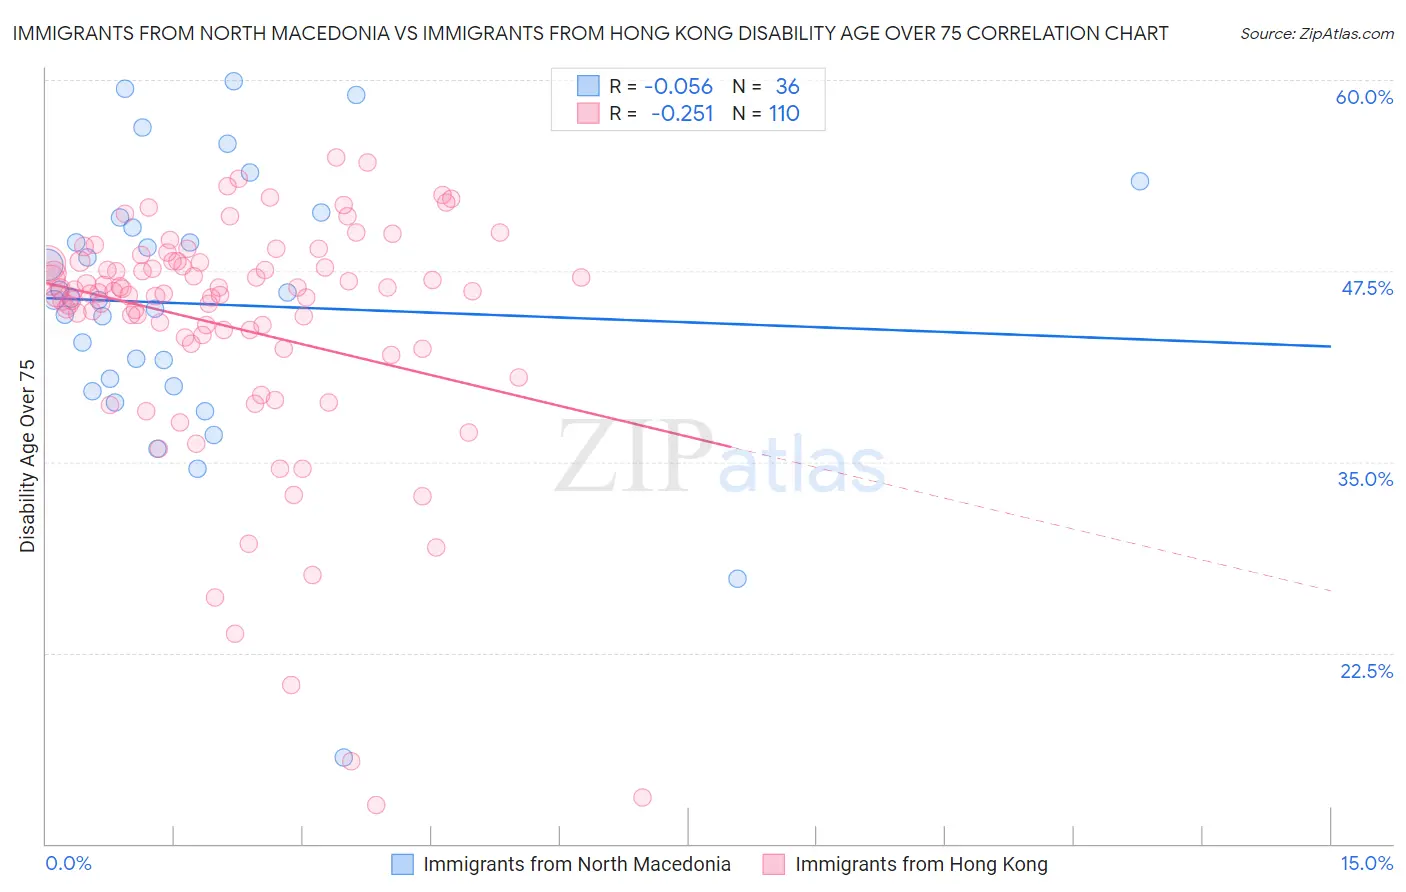
Immigrants from North Macedonia vs Immigrants from Hong Kong Disability Age Over 75 Correlation Chart
The statistical analysis conducted on geographies consisting of 74,296,961 people shows a slight negative correlation between the proportion of Immigrants from North Macedonia and percentage of population with a disability over the age of 75 in the United States with a correlation coefficient (R) of -0.056 and weighted average of 45.9%. Similarly, the statistical analysis conducted on geographies consisting of 253,770,267 people shows a weak negative correlation between the proportion of Immigrants from Hong Kong and percentage of population with a disability over the age of 75 in the United States with a correlation coefficient (R) of -0.251 and weighted average of 46.5%, a difference of 1.2%.
Disability Age Over 75 Correlation Summary
| Measurement | Immigrants from North Macedonia | Immigrants from Hong Kong |
| Minimum | 15.6% | 12.5% |
| Maximum | 59.9% | 54.9% |
| Range | 44.3% | 42.4% |
| Mean | 45.3% | 43.8% |
| Median | 45.7% | 46.0% |
| Interquartile 25% (IQ1) | 40.2% | 42.7% |
| Interquartile 75% (IQ3) | 50.7% | 48.0% |
| Interquartile Range (IQR) | 10.5% | 5.3% |
| Standard Deviation (Sample) | 9.0% | 8.1% |
| Standard Deviation (Population) | 8.9% | 8.1% |
Similar Demographics by Disability Age Over 75
Demographics Similar to Immigrants from North Macedonia by Disability Age Over 75
In terms of disability age over 75, the demographic groups most similar to Immigrants from North Macedonia are Immigrants from Norway (45.9%, a difference of 0.0%), Austrian (46.0%, a difference of 0.030%), Immigrants from England (46.0%, a difference of 0.040%), Burmese (45.9%, a difference of 0.050%), and Immigrants from Spain (46.0%, a difference of 0.070%).
| Demographics | Rating | Rank | Disability Age Over 75 |
| Immigrants | Turkey | 99.6 /100 | #57 | Exceptional 45.9% |
| Immigrants | Israel | 99.6 /100 | #58 | Exceptional 45.9% |
| Iranians | 99.6 /100 | #59 | Exceptional 45.9% |
| Immigrants | Europe | 99.6 /100 | #60 | Exceptional 45.9% |
| Immigrants | Argentina | 99.6 /100 | #61 | Exceptional 45.9% |
| Burmese | 99.5 /100 | #62 | Exceptional 45.9% |
| Immigrants | Norway | 99.5 /100 | #63 | Exceptional 45.9% |
| Immigrants | North Macedonia | 99.5 /100 | #64 | Exceptional 45.9% |
| Austrians | 99.5 /100 | #65 | Exceptional 46.0% |
| Immigrants | England | 99.5 /100 | #66 | Exceptional 46.0% |
| Immigrants | Spain | 99.4 /100 | #67 | Exceptional 46.0% |
| Immigrants | South Central Asia | 99.4 /100 | #68 | Exceptional 46.0% |
| Immigrants | Romania | 99.3 /100 | #69 | Exceptional 46.0% |
| Jordanians | 99.2 /100 | #70 | Exceptional 46.1% |
| Immigrants | Sri Lanka | 99.2 /100 | #71 | Exceptional 46.1% |
Demographics Similar to Immigrants from Hong Kong by Disability Age Over 75
In terms of disability age over 75, the demographic groups most similar to Immigrants from Hong Kong are Immigrants from Chile (46.5%, a difference of 0.0%), Chilean (46.5%, a difference of 0.010%), Brazilian (46.5%, a difference of 0.040%), Immigrants from Pakistan (46.5%, a difference of 0.040%), and Immigrants from Uruguay (46.4%, a difference of 0.050%).
| Demographics | Rating | Rank | Disability Age Over 75 |
| Ukrainians | 97.1 /100 | #103 | Exceptional 46.4% |
| Israelis | 97.0 /100 | #104 | Exceptional 46.4% |
| Immigrants | Cameroon | 96.9 /100 | #105 | Exceptional 46.4% |
| Immigrants | Kuwait | 96.8 /100 | #106 | Exceptional 46.4% |
| Immigrants | Uruguay | 96.7 /100 | #107 | Exceptional 46.4% |
| Brazilians | 96.6 /100 | #108 | Exceptional 46.5% |
| Chileans | 96.4 /100 | #109 | Exceptional 46.5% |
| Immigrants | Hong Kong | 96.4 /100 | #110 | Exceptional 46.5% |
| Immigrants | Chile | 96.4 /100 | #111 | Exceptional 46.5% |
| Immigrants | Pakistan | 96.1 /100 | #112 | Exceptional 46.5% |
| Irish | 96.0 /100 | #113 | Exceptional 46.5% |
| Dutch | 95.9 /100 | #114 | Exceptional 46.5% |
| British | 95.7 /100 | #115 | Exceptional 46.5% |
| Indians (Asian) | 95.7 /100 | #116 | Exceptional 46.5% |
| Hungarians | 95.3 /100 | #117 | Exceptional 46.5% |