Immigrants from North America vs African Disability Age Under 5
COMPARE
Immigrants from North America
African
Disability Age Under 5
Disability Age Under 5 Comparison
Immigrants from North America
Africans
1.4%
DISABILITY AGE UNDER 5
0.1/ 100
METRIC RATING
270th/ 347
METRIC RANK
1.4%
DISABILITY AGE UNDER 5
1.0/ 100
METRIC RATING
250th/ 347
METRIC RANK
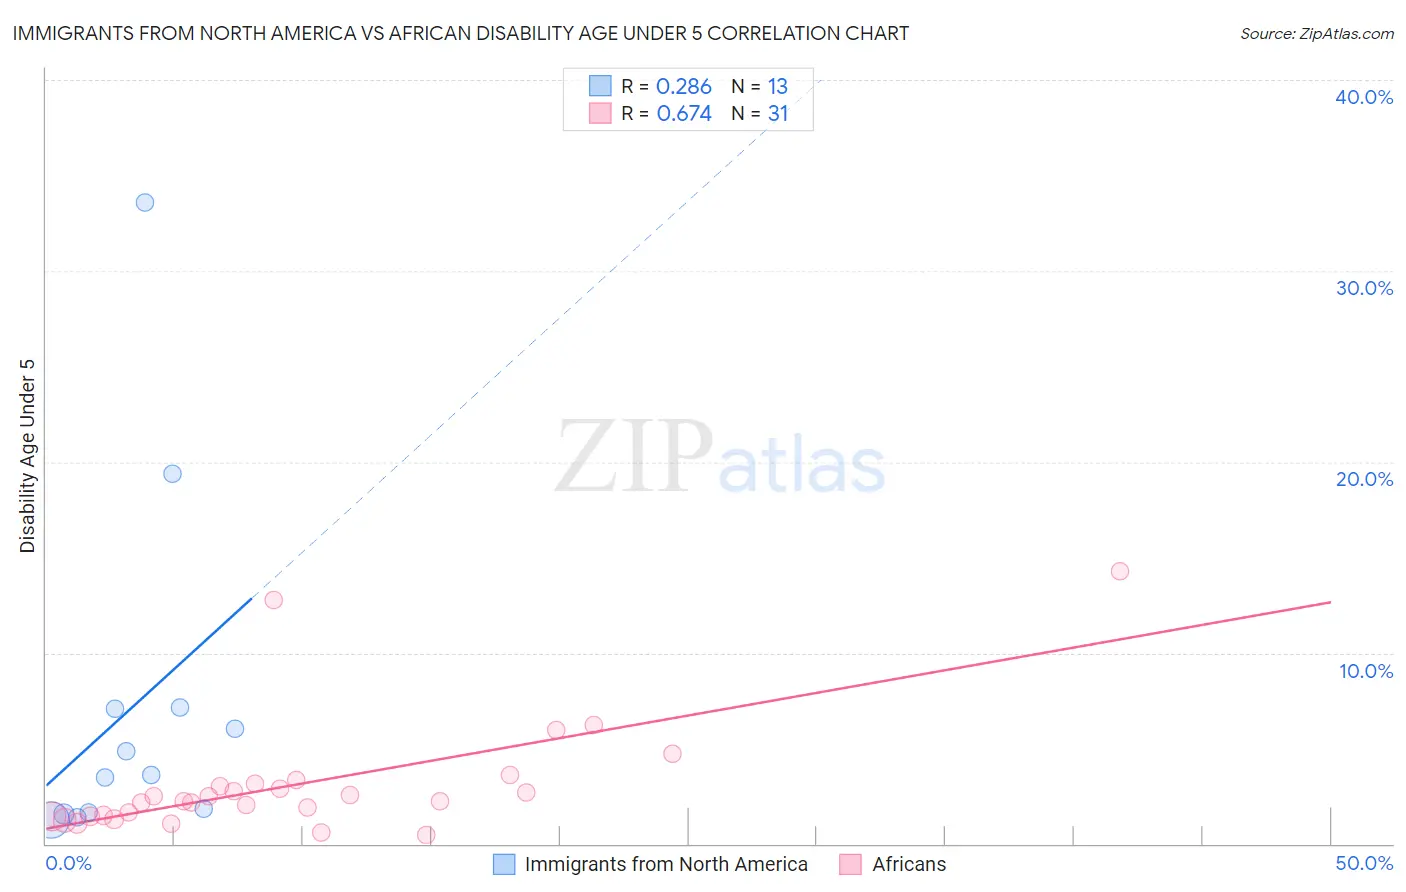
Immigrants from North America vs African Disability Age Under 5 Correlation Chart
The statistical analysis conducted on geographies consisting of 235,432,695 people shows a weak positive correlation between the proportion of Immigrants from North America and percentage of population with a disability under the age of 5 in the United States with a correlation coefficient (R) of 0.286 and weighted average of 1.4%. Similarly, the statistical analysis conducted on geographies consisting of 243,296,599 people shows a significant positive correlation between the proportion of Africans and percentage of population with a disability under the age of 5 in the United States with a correlation coefficient (R) of 0.674 and weighted average of 1.4%, a difference of 5.4%.
Disability Age Under 5 Correlation Summary
| Measurement | Immigrants from North America | African |
| Minimum | 1.3% | 0.47% |
| Maximum | 33.6% | 14.3% |
| Range | 32.3% | 13.8% |
| Mean | 7.1% | 3.1% |
| Median | 3.6% | 2.2% |
| Interquartile 25% (IQ1) | 1.6% | 1.4% |
| Interquartile 75% (IQ3) | 7.1% | 3.1% |
| Interquartile Range (IQR) | 5.5% | 1.7% |
| Standard Deviation (Sample) | 9.3% | 3.1% |
| Standard Deviation (Population) | 8.9% | 3.0% |
Demographics Similar to Immigrants from North America and Africans by Disability Age Under 5
In terms of disability age under 5, the demographic groups most similar to Immigrants from North America are Austrian (1.4%, a difference of 0.13%), Belgian (1.4%, a difference of 0.31%), Cree (1.4%, a difference of 0.89%), Immigrants from Germany (1.4%, a difference of 1.4%), and Carpatho Rusyn (1.4%, a difference of 1.5%). Similarly, the demographic groups most similar to Africans are Immigrants from Hungary (1.4%, a difference of 0.030%), Immigrants from Scotland (1.4%, a difference of 0.070%), Australian (1.4%, a difference of 0.75%), Immigrants from Brazil (1.4%, a difference of 0.83%), and Immigrants from Liberia (1.4%, a difference of 0.89%).
| Demographics | Rating | Rank | Disability Age Under 5 |
| Africans | 1.0 /100 | #250 | Tragic 1.4% |
| Immigrants | Hungary | 1.0 /100 | #251 | Tragic 1.4% |
| Immigrants | Scotland | 0.9 /100 | #252 | Tragic 1.4% |
| Australians | 0.7 /100 | #253 | Tragic 1.4% |
| Immigrants | Brazil | 0.7 /100 | #254 | Tragic 1.4% |
| Immigrants | Liberia | 0.6 /100 | #255 | Tragic 1.4% |
| Immigrants | Western Europe | 0.5 /100 | #256 | Tragic 1.4% |
| Slovenes | 0.3 /100 | #257 | Tragic 1.4% |
| Costa Ricans | 0.3 /100 | #258 | Tragic 1.4% |
| Immigrants | Southern Europe | 0.3 /100 | #259 | Tragic 1.4% |
| Slavs | 0.3 /100 | #260 | Tragic 1.4% |
| Immigrants | Netherlands | 0.2 /100 | #261 | Tragic 1.4% |
| Immigrants | Dominica | 0.2 /100 | #262 | Tragic 1.4% |
| Spanish | 0.2 /100 | #263 | Tragic 1.4% |
| Yugoslavians | 0.1 /100 | #264 | Tragic 1.4% |
| Carpatho Rusyns | 0.1 /100 | #265 | Tragic 1.4% |
| Immigrants | Germany | 0.1 /100 | #266 | Tragic 1.4% |
| Cree | 0.1 /100 | #267 | Tragic 1.4% |
| Belgians | 0.1 /100 | #268 | Tragic 1.4% |
| Austrians | 0.1 /100 | #269 | Tragic 1.4% |
| Immigrants | North America | 0.1 /100 | #270 | Tragic 1.4% |