Immigrants from Nigeria vs Immigrants from South Central Asia Disability Age 65 to 74
COMPARE
Immigrants from Nigeria
Immigrants from South Central Asia
Disability Age 65 to 74
Disability Age 65 to 74 Comparison
Immigrants from Nigeria
Immigrants from South Central Asia
24.0%
DISABILITY AGE 65 TO 74
11.7/ 100
METRIC RATING
218th/ 347
METRIC RANK
20.6%
DISABILITY AGE 65 TO 74
100.0/ 100
METRIC RATING
17th/ 347
METRIC RANK
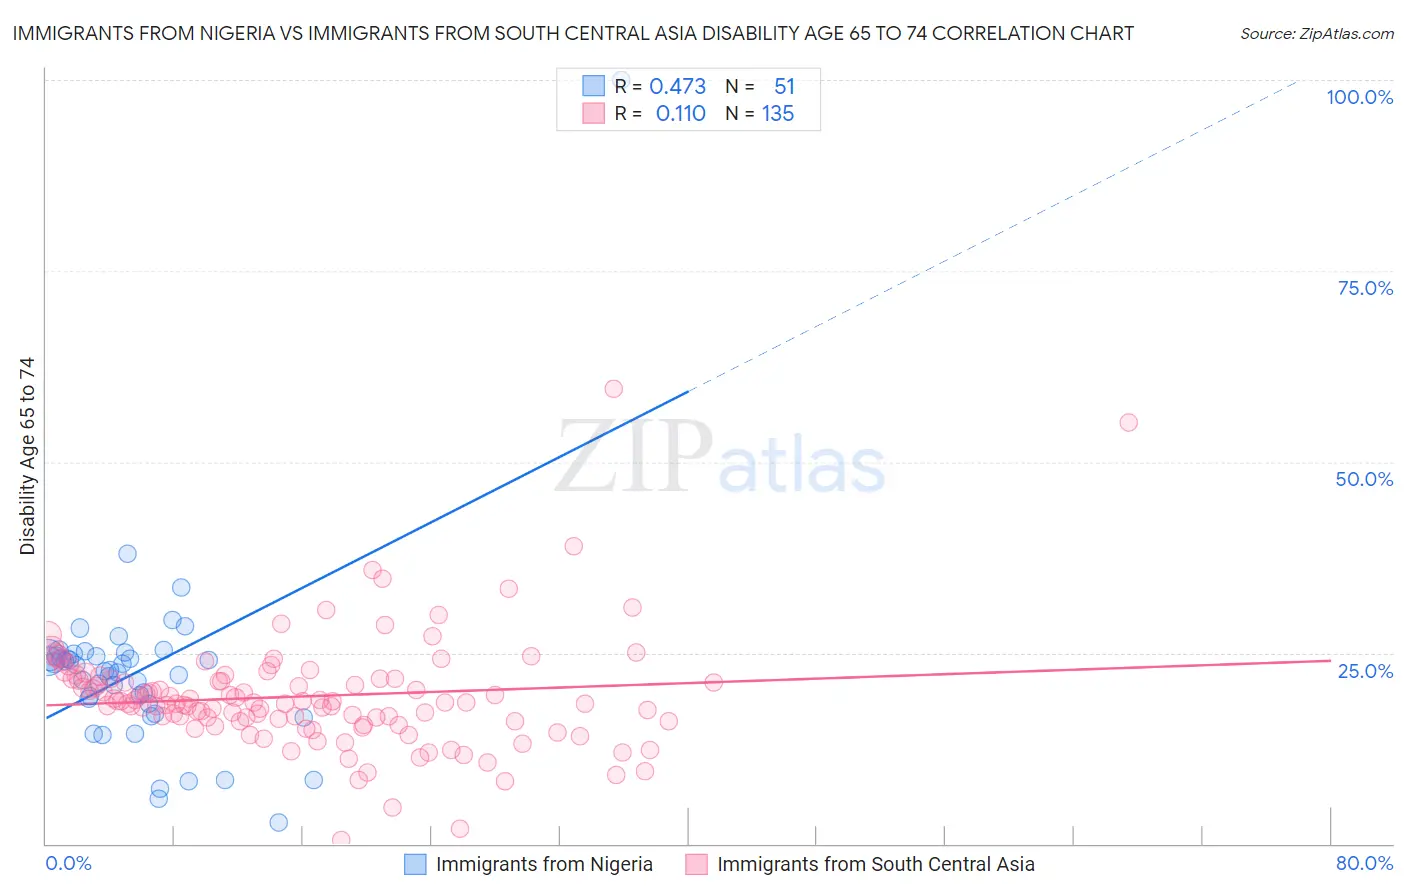
Immigrants from Nigeria vs Immigrants from South Central Asia Disability Age 65 to 74 Correlation Chart
The statistical analysis conducted on geographies consisting of 283,043,731 people shows a moderate positive correlation between the proportion of Immigrants from Nigeria and percentage of population with a disability between the ages 65 and 75 in the United States with a correlation coefficient (R) of 0.473 and weighted average of 24.0%. Similarly, the statistical analysis conducted on geographies consisting of 471,844,047 people shows a poor positive correlation between the proportion of Immigrants from South Central Asia and percentage of population with a disability between the ages 65 and 75 in the United States with a correlation coefficient (R) of 0.110 and weighted average of 20.6%, a difference of 16.6%.
Disability Age 65 to 74 Correlation Summary
| Measurement | Immigrants from Nigeria | Immigrants from South Central Asia |
| Minimum | 2.8% | 0.50% |
| Maximum | 100.0% | 59.5% |
| Range | 97.2% | 59.0% |
| Mean | 22.5% | 19.3% |
| Median | 22.7% | 18.5% |
| Interquartile 25% (IQ1) | 18.3% | 16.1% |
| Interquartile 75% (IQ3) | 24.5% | 21.6% |
| Interquartile Range (IQR) | 6.2% | 5.5% |
| Standard Deviation (Sample) | 13.0% | 7.5% |
| Standard Deviation (Population) | 12.9% | 7.5% |
Similar Demographics by Disability Age 65 to 74
Demographics Similar to Immigrants from Nigeria by Disability Age 65 to 74
In terms of disability age 65 to 74, the demographic groups most similar to Immigrants from Nigeria are Immigrants from Portugal (24.0%, a difference of 0.0%), Immigrants from Burma/Myanmar (24.0%, a difference of 0.020%), Jamaican (24.0%, a difference of 0.070%), Ghanaian (24.1%, a difference of 0.19%), and Pennsylvania German (24.0%, a difference of 0.20%).
| Demographics | Rating | Rank | Disability Age 65 to 74 |
| Immigrants | West Indies | 15.9 /100 | #211 | Poor 23.9% |
| French | 15.7 /100 | #212 | Poor 23.9% |
| Nicaraguans | 14.3 /100 | #213 | Poor 23.9% |
| Immigrants | Oceania | 13.6 /100 | #214 | Poor 24.0% |
| Pennsylvania Germans | 13.3 /100 | #215 | Poor 24.0% |
| Jamaicans | 12.2 /100 | #216 | Poor 24.0% |
| Immigrants | Portugal | 11.7 /100 | #217 | Poor 24.0% |
| Immigrants | Nigeria | 11.7 /100 | #218 | Poor 24.0% |
| Immigrants | Burma/Myanmar | 11.6 /100 | #219 | Poor 24.0% |
| Ghanaians | 10.4 /100 | #220 | Poor 24.1% |
| Immigrants | Nicaragua | 9.8 /100 | #221 | Tragic 24.1% |
| Native Hawaiians | 9.3 /100 | #222 | Tragic 24.1% |
| Immigrants | Middle Africa | 8.9 /100 | #223 | Tragic 24.1% |
| Immigrants | Panama | 8.6 /100 | #224 | Tragic 24.1% |
| Bermudans | 8.2 /100 | #225 | Tragic 24.2% |
Demographics Similar to Immigrants from South Central Asia by Disability Age 65 to 74
In terms of disability age 65 to 74, the demographic groups most similar to Immigrants from South Central Asia are Eastern European (20.6%, a difference of 0.070%), Burmese (20.6%, a difference of 0.10%), Immigrants from Lithuania (20.5%, a difference of 0.25%), Paraguayan (20.5%, a difference of 0.31%), and Indian (Asian) (20.5%, a difference of 0.33%).
| Demographics | Rating | Rank | Disability Age 65 to 74 |
| Immigrants | Eastern Asia | 100.0 /100 | #10 | Exceptional 20.3% |
| Immigrants | Ireland | 100.0 /100 | #11 | Exceptional 20.3% |
| Immigrants | Korea | 100.0 /100 | #12 | Exceptional 20.4% |
| Immigrants | Singapore | 100.0 /100 | #13 | Exceptional 20.4% |
| Indians (Asian) | 100.0 /100 | #14 | Exceptional 20.5% |
| Paraguayans | 100.0 /100 | #15 | Exceptional 20.5% |
| Immigrants | Lithuania | 100.0 /100 | #16 | Exceptional 20.5% |
| Immigrants | South Central Asia | 100.0 /100 | #17 | Exceptional 20.6% |
| Eastern Europeans | 100.0 /100 | #18 | Exceptional 20.6% |
| Burmese | 100.0 /100 | #19 | Exceptional 20.6% |
| Okinawans | 100.0 /100 | #20 | Exceptional 20.7% |
| Immigrants | Bolivia | 99.9 /100 | #21 | Exceptional 20.8% |
| Immigrants | Iran | 99.9 /100 | #22 | Exceptional 20.9% |
| Immigrants | Belgium | 99.9 /100 | #23 | Exceptional 21.0% |
| Soviet Union | 99.9 /100 | #24 | Exceptional 21.0% |