Immigrants from Moldova vs Italian Vision Disability
COMPARE
Immigrants from Moldova
Italian
Vision Disability
Vision Disability Comparison
Immigrants from Moldova
Italians
2.0%
VISION DISABILITY
97.2/ 100
METRIC RATING
86th/ 347
METRIC RANK
2.1%
VISION DISABILITY
79.7/ 100
METRIC RATING
146th/ 347
METRIC RANK
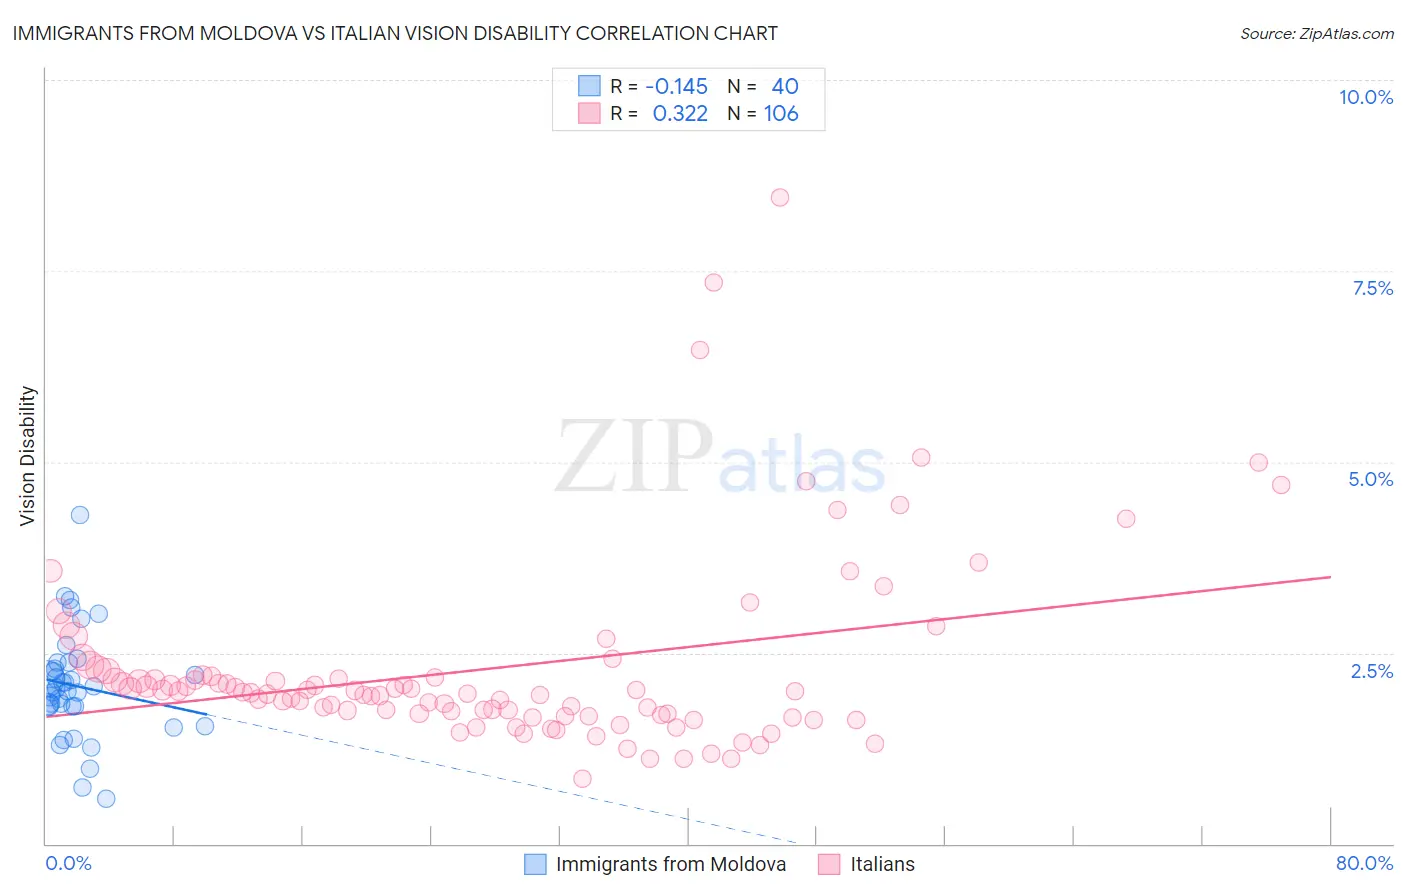
Immigrants from Moldova vs Italian Vision Disability Correlation Chart
The statistical analysis conducted on geographies consisting of 124,355,490 people shows a poor negative correlation between the proportion of Immigrants from Moldova and percentage of population with vision disability in the United States with a correlation coefficient (R) of -0.145 and weighted average of 2.0%. Similarly, the statistical analysis conducted on geographies consisting of 572,776,959 people shows a mild positive correlation between the proportion of Italians and percentage of population with vision disability in the United States with a correlation coefficient (R) of 0.322 and weighted average of 2.1%, a difference of 3.6%.
Vision Disability Correlation Summary
| Measurement | Immigrants from Moldova | Italian |
| Minimum | 0.59% | 0.86% |
| Maximum | 4.3% | 8.5% |
| Range | 3.7% | 7.6% |
| Mean | 2.1% | 2.3% |
| Median | 2.0% | 2.0% |
| Interquartile 25% (IQ1) | 1.8% | 1.7% |
| Interquartile 75% (IQ3) | 2.3% | 2.2% |
| Interquartile Range (IQR) | 0.53% | 0.51% |
| Standard Deviation (Sample) | 0.71% | 1.2% |
| Standard Deviation (Population) | 0.70% | 1.2% |
Similar Demographics by Vision Disability
Demographics Similar to Immigrants from Moldova by Vision Disability
In terms of vision disability, the demographic groups most similar to Immigrants from Moldova are Chinese (2.0%, a difference of 0.020%), Immigrants from Switzerland (2.0%, a difference of 0.060%), Norwegian (2.0%, a difference of 0.070%), Immigrants from Latvia (2.0%, a difference of 0.080%), and Immigrants from Eastern Africa (2.0%, a difference of 0.11%).
| Demographics | Rating | Rank | Vision Disability |
| Assyrians/Chaldeans/Syriacs | 98.1 /100 | #79 | Exceptional 2.0% |
| Lithuanians | 97.7 /100 | #80 | Exceptional 2.0% |
| Soviet Union | 97.6 /100 | #81 | Exceptional 2.0% |
| Immigrants | Poland | 97.6 /100 | #82 | Exceptional 2.0% |
| Immigrants | Western Asia | 97.5 /100 | #83 | Exceptional 2.0% |
| Immigrants | Latvia | 97.3 /100 | #84 | Exceptional 2.0% |
| Chinese | 97.2 /100 | #85 | Exceptional 2.0% |
| Immigrants | Moldova | 97.2 /100 | #86 | Exceptional 2.0% |
| Immigrants | Switzerland | 97.0 /100 | #87 | Exceptional 2.0% |
| Norwegians | 97.0 /100 | #88 | Exceptional 2.0% |
| Immigrants | Eastern Africa | 97.0 /100 | #89 | Exceptional 2.0% |
| Immigrants | Lebanon | 96.7 /100 | #90 | Exceptional 2.1% |
| Immigrants | Somalia | 96.2 /100 | #91 | Exceptional 2.1% |
| Immigrants | Syria | 96.2 /100 | #92 | Exceptional 2.1% |
| Immigrants | Europe | 96.1 /100 | #93 | Exceptional 2.1% |
Demographics Similar to Italians by Vision Disability
In terms of vision disability, the demographic groups most similar to Italians are Immigrants from Sudan (2.1%, a difference of 0.13%), Finnish (2.1%, a difference of 0.14%), Immigrants from Bosnia and Herzegovina (2.1%, a difference of 0.18%), Ukrainian (2.1%, a difference of 0.23%), and South American (2.1%, a difference of 0.33%).
| Demographics | Rating | Rank | Vision Disability |
| Immigrants | Morocco | 85.2 /100 | #139 | Excellent 2.1% |
| Immigrants | Netherlands | 84.2 /100 | #140 | Excellent 2.1% |
| Sierra Leoneans | 84.1 /100 | #141 | Excellent 2.1% |
| South Americans | 82.8 /100 | #142 | Excellent 2.1% |
| Immigrants | Sierra Leone | 82.8 /100 | #143 | Excellent 2.1% |
| Ukrainians | 81.9 /100 | #144 | Excellent 2.1% |
| Immigrants | Bosnia and Herzegovina | 81.5 /100 | #145 | Excellent 2.1% |
| Italians | 79.7 /100 | #146 | Good 2.1% |
| Immigrants | Sudan | 78.4 /100 | #147 | Good 2.1% |
| Finns | 78.3 /100 | #148 | Good 2.1% |
| Colombians | 76.2 /100 | #149 | Good 2.1% |
| Belgians | 75.9 /100 | #150 | Good 2.1% |
| Immigrants | Norway | 75.5 /100 | #151 | Good 2.1% |
| Immigrants | Southern Europe | 74.6 /100 | #152 | Good 2.1% |
| Immigrants | South America | 73.8 /100 | #153 | Good 2.1% |