Immigrants from Malaysia vs Iranian Disability Age 18 to 34
COMPARE
Immigrants from Malaysia
Iranian
Disability Age 18 to 34
Disability Age 18 to 34 Comparison
Immigrants from Malaysia
Iranians
5.9%
DISABILITY AGE 18 TO 34
99.7/ 100
METRIC RATING
54th/ 347
METRIC RANK
5.8%
DISABILITY AGE 18 TO 34
99.9/ 100
METRIC RATING
31st/ 347
METRIC RANK
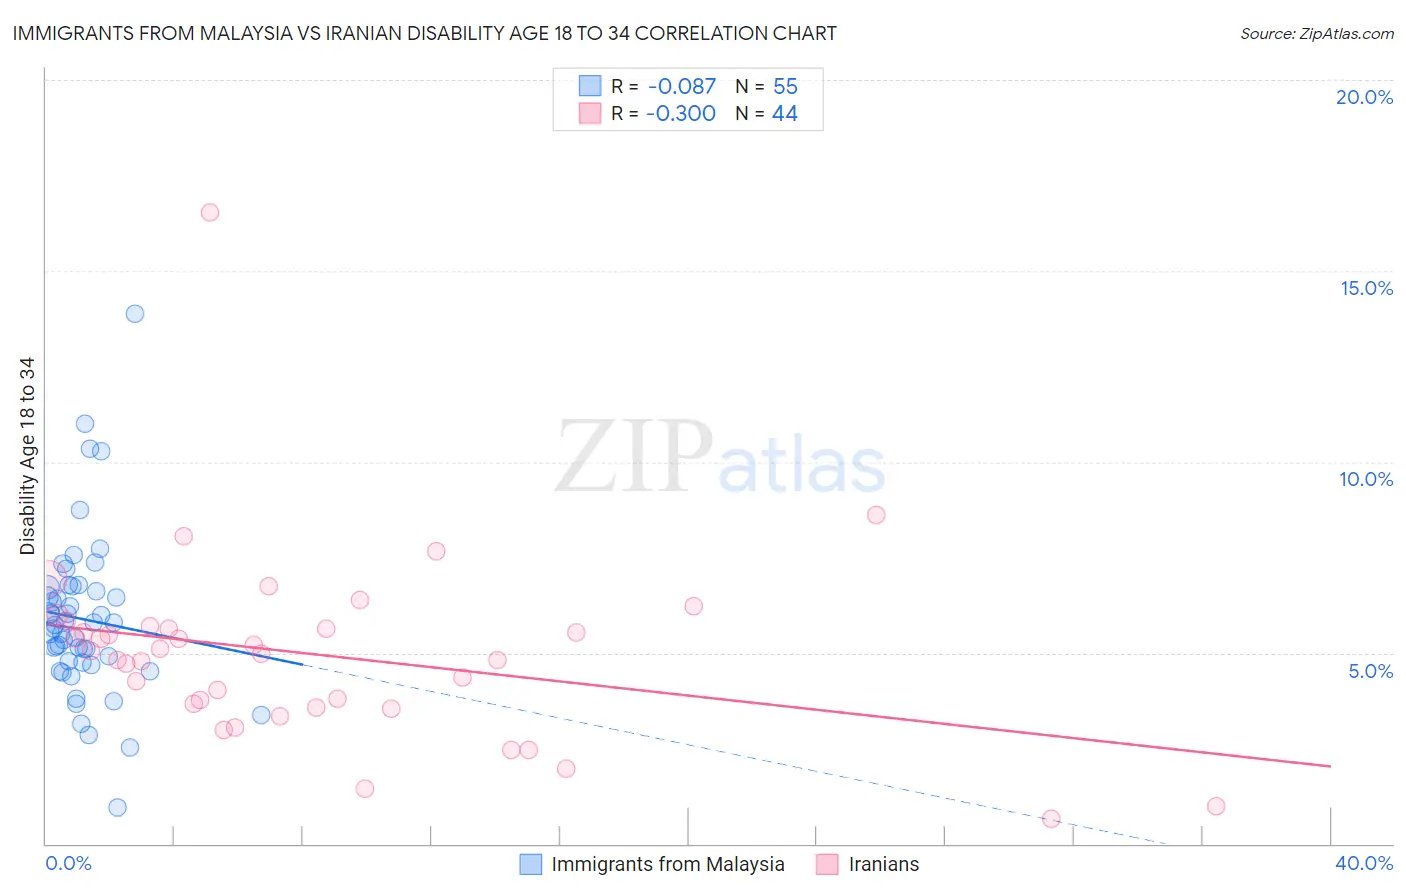
Immigrants from Malaysia vs Iranian Disability Age 18 to 34 Correlation Chart
The statistical analysis conducted on geographies consisting of 197,835,330 people shows a slight negative correlation between the proportion of Immigrants from Malaysia and percentage of population with a disability between the ages 18 and 35 in the United States with a correlation coefficient (R) of -0.087 and weighted average of 5.9%. Similarly, the statistical analysis conducted on geographies consisting of 316,452,778 people shows a weak negative correlation between the proportion of Iranians and percentage of population with a disability between the ages 18 and 35 in the United States with a correlation coefficient (R) of -0.300 and weighted average of 5.8%, a difference of 2.8%.
Disability Age 18 to 34 Correlation Summary
| Measurement | Immigrants from Malaysia | Iranian |
| Minimum | 0.94% | 0.66% |
| Maximum | 13.9% | 16.5% |
| Range | 12.9% | 15.9% |
| Mean | 5.9% | 5.0% |
| Median | 5.7% | 5.0% |
| Interquartile 25% (IQ1) | 4.8% | 3.6% |
| Interquartile 75% (IQ3) | 6.7% | 5.7% |
| Interquartile Range (IQR) | 1.9% | 2.0% |
| Standard Deviation (Sample) | 2.1% | 2.5% |
| Standard Deviation (Population) | 2.1% | 2.5% |
Similar Demographics by Disability Age 18 to 34
Demographics Similar to Immigrants from Malaysia by Disability Age 18 to 34
In terms of disability age 18 to 34, the demographic groups most similar to Immigrants from Malaysia are Immigrants from Spain (5.9%, a difference of 0.010%), Immigrants from Indonesia (5.9%, a difference of 0.050%), Paraguayan (5.9%, a difference of 0.17%), Okinawan (5.9%, a difference of 0.19%), and Immigrants from Haiti (5.9%, a difference of 0.28%).
| Demographics | Rating | Rank | Disability Age 18 to 34 |
| Immigrants | Egypt | 99.8 /100 | #47 | Exceptional 5.9% |
| Immigrants | Trinidad and Tobago | 99.8 /100 | #48 | Exceptional 5.9% |
| Immigrants | Belarus | 99.8 /100 | #49 | Exceptional 5.9% |
| Immigrants | El Salvador | 99.8 /100 | #50 | Exceptional 5.9% |
| Egyptians | 99.8 /100 | #51 | Exceptional 5.9% |
| Okinawans | 99.7 /100 | #52 | Exceptional 5.9% |
| Immigrants | Indonesia | 99.7 /100 | #53 | Exceptional 5.9% |
| Immigrants | Malaysia | 99.7 /100 | #54 | Exceptional 5.9% |
| Immigrants | Spain | 99.7 /100 | #55 | Exceptional 5.9% |
| Paraguayans | 99.7 /100 | #56 | Exceptional 5.9% |
| Immigrants | Haiti | 99.7 /100 | #57 | Exceptional 5.9% |
| Immigrants | Serbia | 99.7 /100 | #58 | Exceptional 5.9% |
| Immigrants | Caribbean | 99.6 /100 | #59 | Exceptional 6.0% |
| Immigrants | Sri Lanka | 99.6 /100 | #60 | Exceptional 6.0% |
| British West Indians | 99.6 /100 | #61 | Exceptional 6.0% |
Demographics Similar to Iranians by Disability Age 18 to 34
In terms of disability age 18 to 34, the demographic groups most similar to Iranians are Immigrants from Barbados (5.8%, a difference of 0.0%), Argentinean (5.8%, a difference of 0.020%), Venezuelan (5.8%, a difference of 0.21%), Immigrants from Pakistan (5.8%, a difference of 0.32%), and Immigrants from Lithuania (5.8%, a difference of 0.44%).
| Demographics | Rating | Rank | Disability Age 18 to 34 |
| Immigrants | Argentina | 100.0 /100 | #24 | Exceptional 5.7% |
| Immigrants | Singapore | 100.0 /100 | #25 | Exceptional 5.7% |
| Immigrants | Colombia | 100.0 /100 | #26 | Exceptional 5.7% |
| Immigrants | Venezuela | 99.9 /100 | #27 | Exceptional 5.7% |
| Soviet Union | 99.9 /100 | #28 | Exceptional 5.7% |
| Immigrants | Ecuador | 99.9 /100 | #29 | Exceptional 5.7% |
| Immigrants | Pakistan | 99.9 /100 | #30 | Exceptional 5.8% |
| Iranians | 99.9 /100 | #31 | Exceptional 5.8% |
| Immigrants | Barbados | 99.9 /100 | #32 | Exceptional 5.8% |
| Argentineans | 99.9 /100 | #33 | Exceptional 5.8% |
| Venezuelans | 99.9 /100 | #34 | Exceptional 5.8% |
| Immigrants | Lithuania | 99.9 /100 | #35 | Exceptional 5.8% |
| Ecuadorians | 99.9 /100 | #36 | Exceptional 5.8% |
| Armenians | 99.9 /100 | #37 | Exceptional 5.8% |
| Immigrants | South America | 99.9 /100 | #38 | Exceptional 5.8% |