Immigrants from Liberia vs Senegalese Disability Age Under 5
COMPARE
Immigrants from Liberia
Senegalese
Disability Age Under 5
Disability Age Under 5 Comparison
Immigrants from Liberia
Senegalese
1.4%
DISABILITY AGE UNDER 5
0.6/ 100
METRIC RATING
255th/ 347
METRIC RANK
1.2%
DISABILITY AGE UNDER 5
94.6/ 100
METRIC RATING
111th/ 347
METRIC RANK
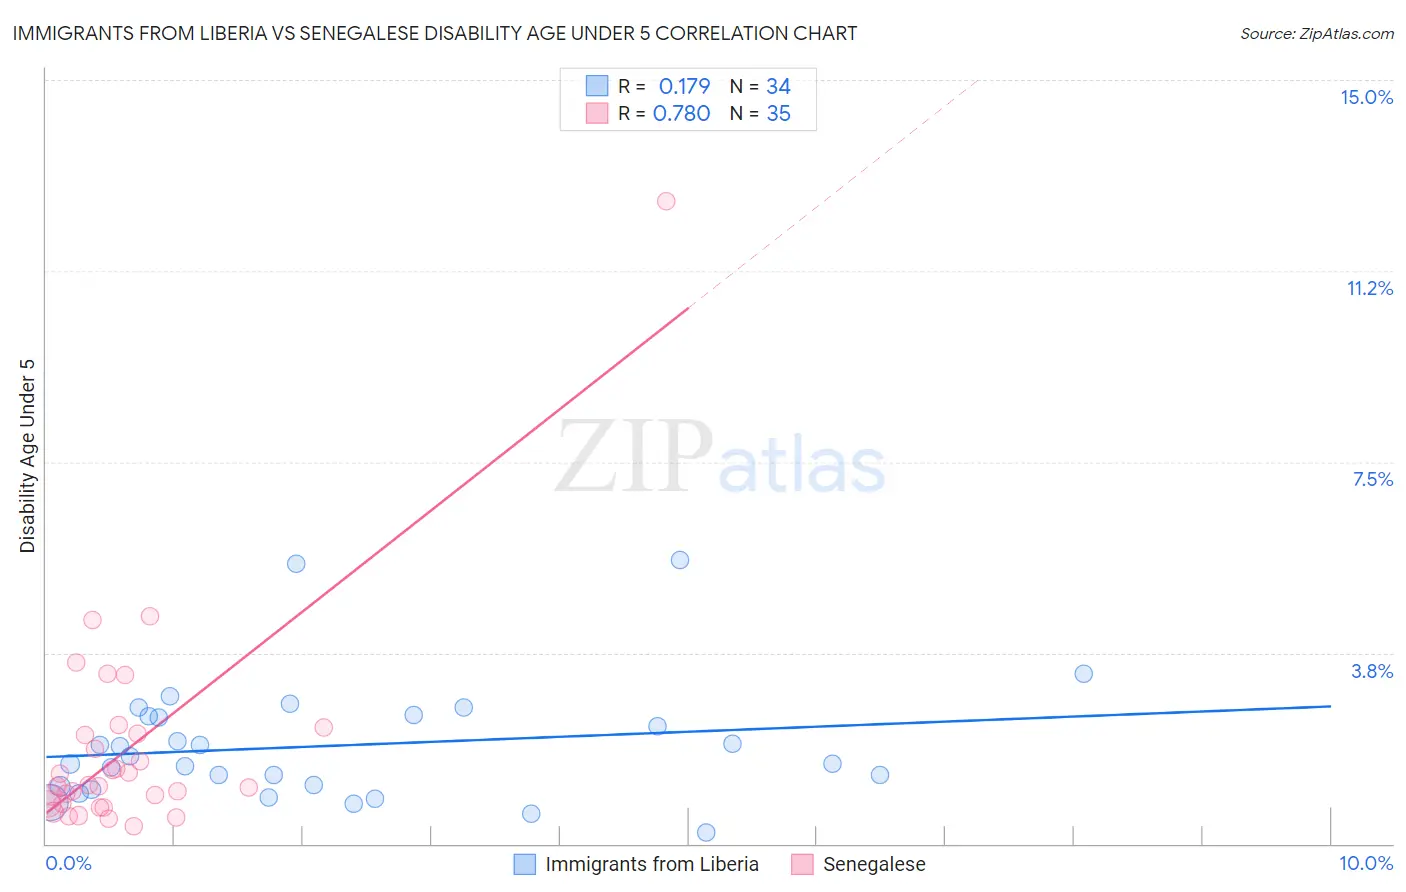
Immigrants from Liberia vs Senegalese Disability Age Under 5 Correlation Chart
The statistical analysis conducted on geographies consisting of 98,567,169 people shows a poor positive correlation between the proportion of Immigrants from Liberia and percentage of population with a disability under the age of 5 in the United States with a correlation coefficient (R) of 0.179 and weighted average of 1.4%. Similarly, the statistical analysis conducted on geographies consisting of 62,306,904 people shows a strong positive correlation between the proportion of Senegalese and percentage of population with a disability under the age of 5 in the United States with a correlation coefficient (R) of 0.780 and weighted average of 1.2%, a difference of 19.1%.
Disability Age Under 5 Correlation Summary
| Measurement | Immigrants from Liberia | Senegalese |
| Minimum | 0.22% | 0.35% |
| Maximum | 5.6% | 12.6% |
| Range | 5.3% | 12.3% |
| Mean | 1.9% | 1.9% |
| Median | 1.6% | 1.1% |
| Interquartile 25% (IQ1) | 1.1% | 0.77% |
| Interquartile 75% (IQ3) | 2.5% | 2.2% |
| Interquartile Range (IQR) | 1.4% | 1.4% |
| Standard Deviation (Sample) | 1.2% | 2.2% |
| Standard Deviation (Population) | 1.2% | 2.1% |
Similar Demographics by Disability Age Under 5
Demographics Similar to Immigrants from Liberia by Disability Age Under 5
In terms of disability age under 5, the demographic groups most similar to Immigrants from Liberia are Immigrants from Brazil (1.4%, a difference of 0.060%), Australian (1.4%, a difference of 0.14%), Immigrants from Western Europe (1.4%, a difference of 0.42%), Immigrants from Scotland (1.4%, a difference of 0.81%), and Immigrants from Hungary (1.4%, a difference of 0.86%).
| Demographics | Rating | Rank | Disability Age Under 5 |
| Eastern Europeans | 1.0 /100 | #248 | Tragic 1.4% |
| Bermudans | 1.0 /100 | #249 | Tragic 1.4% |
| Africans | 1.0 /100 | #250 | Tragic 1.4% |
| Immigrants | Hungary | 1.0 /100 | #251 | Tragic 1.4% |
| Immigrants | Scotland | 0.9 /100 | #252 | Tragic 1.4% |
| Australians | 0.7 /100 | #253 | Tragic 1.4% |
| Immigrants | Brazil | 0.7 /100 | #254 | Tragic 1.4% |
| Immigrants | Liberia | 0.6 /100 | #255 | Tragic 1.4% |
| Immigrants | Western Europe | 0.5 /100 | #256 | Tragic 1.4% |
| Slovenes | 0.3 /100 | #257 | Tragic 1.4% |
| Costa Ricans | 0.3 /100 | #258 | Tragic 1.4% |
| Immigrants | Southern Europe | 0.3 /100 | #259 | Tragic 1.4% |
| Slavs | 0.3 /100 | #260 | Tragic 1.4% |
| Immigrants | Netherlands | 0.2 /100 | #261 | Tragic 1.4% |
| Immigrants | Dominica | 0.2 /100 | #262 | Tragic 1.4% |
Demographics Similar to Senegalese by Disability Age Under 5
In terms of disability age under 5, the demographic groups most similar to Senegalese are Immigrants from Australia (1.2%, a difference of 0.11%), Immigrants from Oceania (1.2%, a difference of 0.17%), Immigrants from Lebanon (1.2%, a difference of 0.20%), Immigrants from Panama (1.2%, a difference of 0.22%), and Iraqi (1.2%, a difference of 0.24%).
| Demographics | Rating | Rank | Disability Age Under 5 |
| Indonesians | 95.9 /100 | #104 | Exceptional 1.2% |
| Immigrants | South Africa | 95.6 /100 | #105 | Exceptional 1.2% |
| Cambodians | 95.4 /100 | #106 | Exceptional 1.2% |
| Immigrants | West Indies | 95.3 /100 | #107 | Exceptional 1.2% |
| Iraqis | 95.1 /100 | #108 | Exceptional 1.2% |
| Immigrants | Panama | 95.0 /100 | #109 | Exceptional 1.2% |
| Immigrants | Lebanon | 95.0 /100 | #110 | Exceptional 1.2% |
| Senegalese | 94.6 /100 | #111 | Exceptional 1.2% |
| Immigrants | Australia | 94.4 /100 | #112 | Exceptional 1.2% |
| Immigrants | Oceania | 94.2 /100 | #113 | Exceptional 1.2% |
| Belizeans | 93.9 /100 | #114 | Exceptional 1.2% |
| Immigrants | Caribbean | 93.8 /100 | #115 | Exceptional 1.2% |
| Immigrants | Northern Africa | 93.8 /100 | #116 | Exceptional 1.2% |
| Immigrants | Philippines | 93.5 /100 | #117 | Exceptional 1.2% |
| Immigrants | Venezuela | 93.4 /100 | #118 | Exceptional 1.2% |