Immigrants from Latvia vs Immigrants from Russia Disability Age 65 to 74
COMPARE
Immigrants from Latvia
Immigrants from Russia
Disability Age 65 to 74
Disability Age 65 to 74 Comparison
Immigrants from Latvia
Immigrants from Russia
21.6%
DISABILITY AGE 65 TO 74
99.4/ 100
METRIC RATING
64th/ 347
METRIC RANK
21.6%
DISABILITY AGE 65 TO 74
99.4/ 100
METRIC RATING
65th/ 347
METRIC RANK
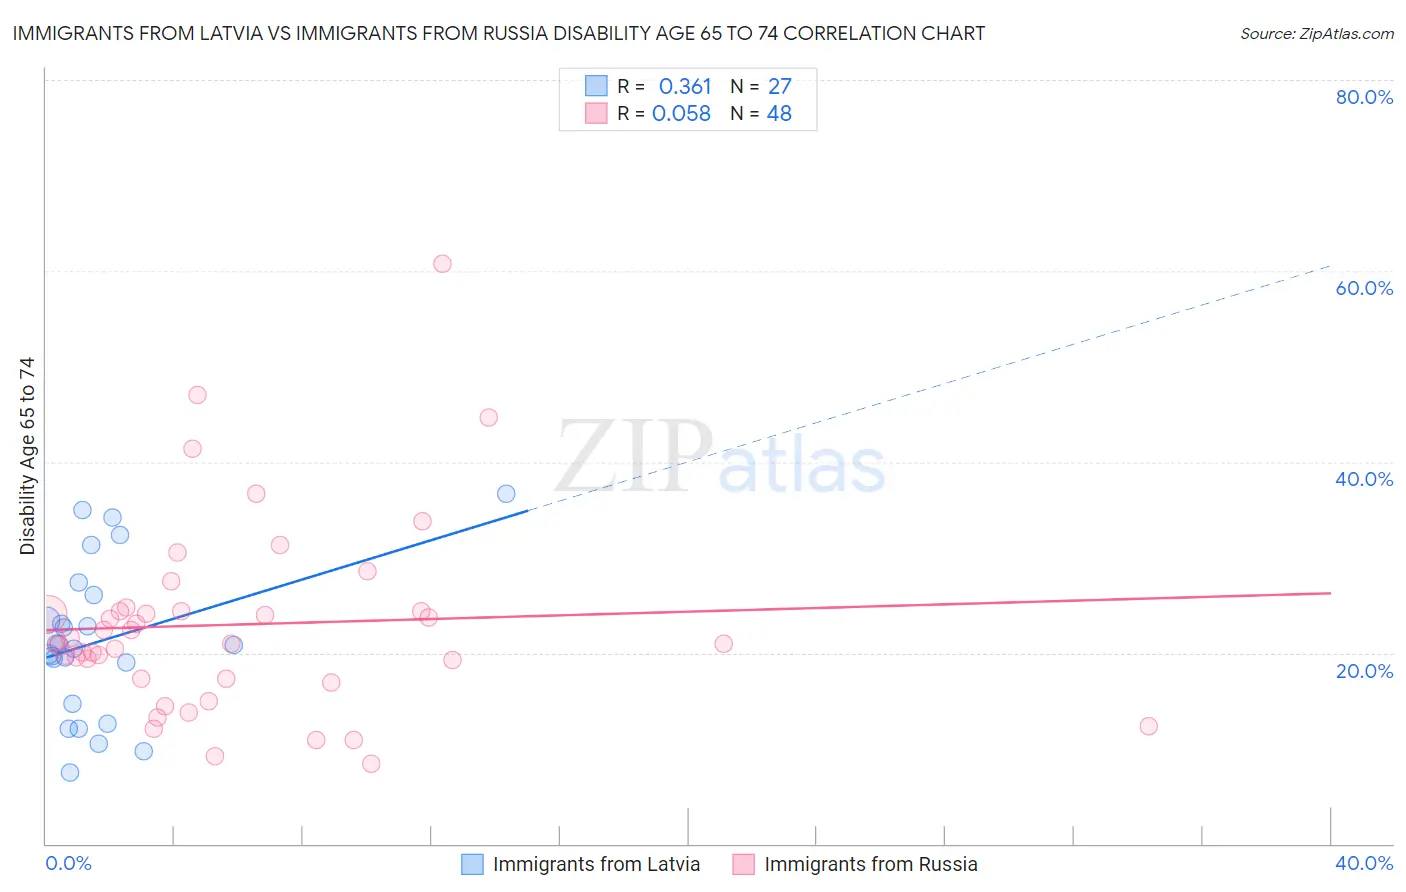
Immigrants from Latvia vs Immigrants from Russia Disability Age 65 to 74 Correlation Chart
The statistical analysis conducted on geographies consisting of 113,682,371 people shows a mild positive correlation between the proportion of Immigrants from Latvia and percentage of population with a disability between the ages 65 and 75 in the United States with a correlation coefficient (R) of 0.361 and weighted average of 21.6%. Similarly, the statistical analysis conducted on geographies consisting of 347,329,663 people shows a slight positive correlation between the proportion of Immigrants from Russia and percentage of population with a disability between the ages 65 and 75 in the United States with a correlation coefficient (R) of 0.058 and weighted average of 21.6%, a difference of 0.010%.
Disability Age 65 to 74 Correlation Summary
| Measurement | Immigrants from Latvia | Immigrants from Russia |
| Minimum | 7.5% | 8.3% |
| Maximum | 36.7% | 60.7% |
| Range | 29.2% | 52.4% |
| Mean | 21.3% | 23.0% |
| Median | 20.8% | 21.1% |
| Interquartile 25% (IQ1) | 14.6% | 17.3% |
| Interquartile 75% (IQ3) | 26.0% | 24.4% |
| Interquartile Range (IQR) | 11.4% | 7.1% |
| Standard Deviation (Sample) | 7.9% | 10.1% |
| Standard Deviation (Population) | 7.8% | 10.0% |
Demographics Similar to Immigrants from Latvia and Immigrants from Russia by Disability Age 65 to 74
In terms of disability age 65 to 74, the demographic groups most similar to Immigrants from Latvia are Maltese (21.6%, a difference of 0.030%), Immigrants from Europe (21.6%, a difference of 0.080%), Carpatho Rusyn (21.6%, a difference of 0.18%), Egyptian (21.6%, a difference of 0.20%), and Immigrants from North Macedonia (21.6%, a difference of 0.23%). Similarly, the demographic groups most similar to Immigrants from Russia are Maltese (21.6%, a difference of 0.010%), Immigrants from Europe (21.6%, a difference of 0.090%), Carpatho Rusyn (21.6%, a difference of 0.19%), Egyptian (21.6%, a difference of 0.22%), and Immigrants from South Africa (21.7%, a difference of 0.22%).
| Demographics | Rating | Rank | Disability Age 65 to 74 |
| Immigrants | Italy | 99.6 /100 | #54 | Exceptional 21.5% |
| Immigrants | Romania | 99.5 /100 | #55 | Exceptional 21.5% |
| Immigrants | Denmark | 99.5 /100 | #56 | Exceptional 21.5% |
| Immigrants | Asia | 99.5 /100 | #57 | Exceptional 21.5% |
| Immigrants | Pakistan | 99.5 /100 | #58 | Exceptional 21.5% |
| Zimbabweans | 99.5 /100 | #59 | Exceptional 21.5% |
| Immigrants | North Macedonia | 99.5 /100 | #60 | Exceptional 21.6% |
| Egyptians | 99.5 /100 | #61 | Exceptional 21.6% |
| Carpatho Rusyns | 99.5 /100 | #62 | Exceptional 21.6% |
| Immigrants | Europe | 99.4 /100 | #63 | Exceptional 21.6% |
| Immigrants | Latvia | 99.4 /100 | #64 | Exceptional 21.6% |
| Immigrants | Russia | 99.4 /100 | #65 | Exceptional 21.6% |
| Maltese | 99.4 /100 | #66 | Exceptional 21.6% |
| Immigrants | South Africa | 99.3 /100 | #67 | Exceptional 21.7% |
| Immigrants | Scotland | 99.3 /100 | #68 | Exceptional 21.7% |
| Immigrants | Egypt | 99.2 /100 | #69 | Exceptional 21.7% |
| Chinese | 99.2 /100 | #70 | Exceptional 21.7% |
| Immigrants | Belarus | 99.2 /100 | #71 | Exceptional 21.7% |
| Immigrants | Hungary | 99.2 /100 | #72 | Exceptional 21.7% |
| Immigrants | Venezuela | 99.0 /100 | #73 | Exceptional 21.8% |
| Cambodians | 99.0 /100 | #74 | Exceptional 21.8% |