Immigrants from Latin America vs Immigrants from Trinidad and Tobago Disability Age 18 to 34
COMPARE
Immigrants from Latin America
Immigrants from Trinidad and Tobago
Disability Age 18 to 34
Disability Age 18 to 34 Comparison
Immigrants from Latin America
Immigrants from Trinidad and Tobago
6.3%
DISABILITY AGE 18 TO 34
94.9/ 100
METRIC RATING
113th/ 347
METRIC RANK
5.9%
DISABILITY AGE 18 TO 34
99.8/ 100
METRIC RATING
48th/ 347
METRIC RANK
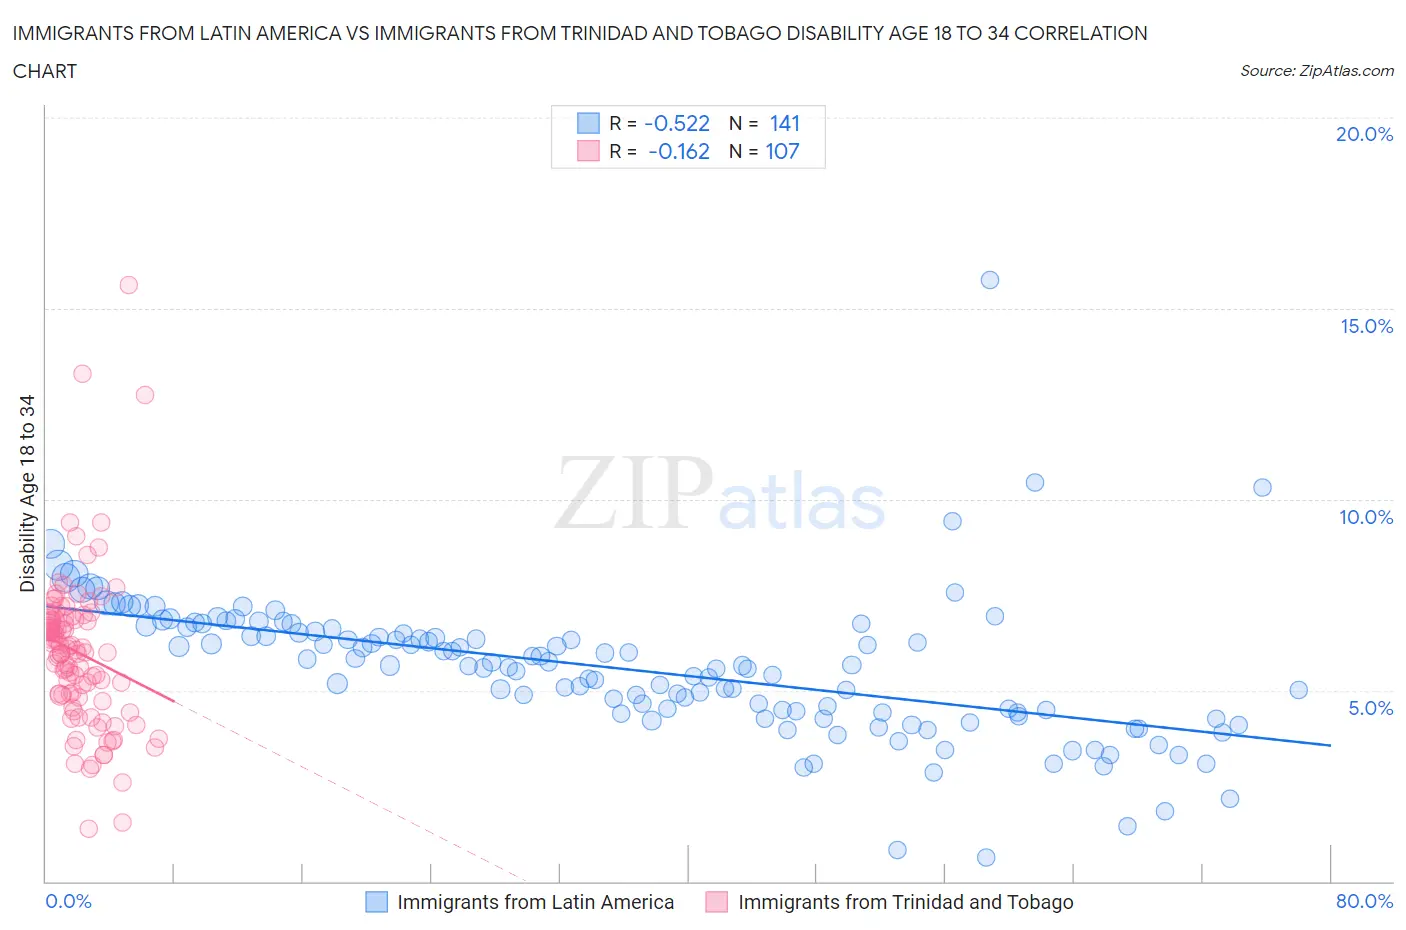
Immigrants from Latin America vs Immigrants from Trinidad and Tobago Disability Age 18 to 34 Correlation Chart
The statistical analysis conducted on geographies consisting of 554,113,757 people shows a substantial negative correlation between the proportion of Immigrants from Latin America and percentage of population with a disability between the ages 18 and 35 in the United States with a correlation coefficient (R) of -0.522 and weighted average of 6.3%. Similarly, the statistical analysis conducted on geographies consisting of 223,304,985 people shows a poor negative correlation between the proportion of Immigrants from Trinidad and Tobago and percentage of population with a disability between the ages 18 and 35 in the United States with a correlation coefficient (R) of -0.162 and weighted average of 5.9%, a difference of 6.1%.
Disability Age 18 to 34 Correlation Summary
| Measurement | Immigrants from Latin America | Immigrants from Trinidad and Tobago |
| Minimum | 0.64% | 1.4% |
| Maximum | 15.8% | 15.6% |
| Range | 15.1% | 14.2% |
| Mean | 5.6% | 6.0% |
| Median | 5.6% | 6.0% |
| Interquartile 25% (IQ1) | 4.4% | 4.8% |
| Interquartile 75% (IQ3) | 6.6% | 6.8% |
| Interquartile Range (IQR) | 2.1% | 2.0% |
| Standard Deviation (Sample) | 1.9% | 2.1% |
| Standard Deviation (Population) | 1.8% | 2.1% |
Similar Demographics by Disability Age 18 to 34
Demographics Similar to Immigrants from Latin America by Disability Age 18 to 34
In terms of disability age 18 to 34, the demographic groups most similar to Immigrants from Latin America are Immigrants from Romania (6.3%, a difference of 0.0%), Immigrants from France (6.3%, a difference of 0.090%), Immigrants from Brazil (6.3%, a difference of 0.10%), Immigrants from South Eastern Asia (6.3%, a difference of 0.18%), and Sri Lankan (6.2%, a difference of 0.25%).
| Demographics | Rating | Rank | Disability Age 18 to 34 |
| Immigrants | Afghanistan | 95.9 /100 | #106 | Exceptional 6.2% |
| Ethiopians | 95.8 /100 | #107 | Exceptional 6.2% |
| Immigrants | Croatia | 95.7 /100 | #108 | Exceptional 6.2% |
| Sri Lankans | 95.5 /100 | #109 | Exceptional 6.2% |
| Immigrants | Brazil | 95.2 /100 | #110 | Exceptional 6.3% |
| Immigrants | France | 95.1 /100 | #111 | Exceptional 6.3% |
| Immigrants | Romania | 94.9 /100 | #112 | Exceptional 6.3% |
| Immigrants | Latin America | 94.9 /100 | #113 | Exceptional 6.3% |
| Immigrants | South Eastern Asia | 94.4 /100 | #114 | Exceptional 6.3% |
| Koreans | 94.1 /100 | #115 | Exceptional 6.3% |
| Immigrants | Costa Rica | 94.0 /100 | #116 | Exceptional 6.3% |
| Immigrants | Jordan | 94.0 /100 | #117 | Exceptional 6.3% |
| Immigrants | Nepal | 93.7 /100 | #118 | Exceptional 6.3% |
| Chileans | 93.5 /100 | #119 | Exceptional 6.3% |
| Immigrants | Ukraine | 93.4 /100 | #120 | Exceptional 6.3% |
Demographics Similar to Immigrants from Trinidad and Tobago by Disability Age 18 to 34
In terms of disability age 18 to 34, the demographic groups most similar to Immigrants from Trinidad and Tobago are Immigrants from Belarus (5.9%, a difference of 0.10%), Immigrants from El Salvador (5.9%, a difference of 0.14%), Egyptian (5.9%, a difference of 0.14%), Okinawan (5.9%, a difference of 0.28%), and Immigrants from Egypt (5.9%, a difference of 0.42%).
| Demographics | Rating | Rank | Disability Age 18 to 34 |
| Nicaraguans | 99.9 /100 | #41 | Exceptional 5.8% |
| Colombians | 99.8 /100 | #42 | Exceptional 5.9% |
| South Americans | 99.8 /100 | #43 | Exceptional 5.9% |
| Immigrants | Asia | 99.8 /100 | #44 | Exceptional 5.9% |
| Immigrants | Peru | 99.8 /100 | #45 | Exceptional 5.9% |
| Immigrants | Korea | 99.8 /100 | #46 | Exceptional 5.9% |
| Immigrants | Egypt | 99.8 /100 | #47 | Exceptional 5.9% |
| Immigrants | Trinidad and Tobago | 99.8 /100 | #48 | Exceptional 5.9% |
| Immigrants | Belarus | 99.8 /100 | #49 | Exceptional 5.9% |
| Immigrants | El Salvador | 99.8 /100 | #50 | Exceptional 5.9% |
| Egyptians | 99.8 /100 | #51 | Exceptional 5.9% |
| Okinawans | 99.7 /100 | #52 | Exceptional 5.9% |
| Immigrants | Indonesia | 99.7 /100 | #53 | Exceptional 5.9% |
| Immigrants | Malaysia | 99.7 /100 | #54 | Exceptional 5.9% |
| Immigrants | Spain | 99.7 /100 | #55 | Exceptional 5.9% |