Immigrants from Jordan vs Slovene Vision Disability
COMPARE
Immigrants from Jordan
Slovene
Vision Disability
Vision Disability Comparison
Immigrants from Jordan
Slovenes
2.0%
VISION DISABILITY
98.3/ 100
METRIC RATING
77th/ 347
METRIC RANK
2.1%
VISION DISABILITY
73.6/ 100
METRIC RATING
154th/ 347
METRIC RANK
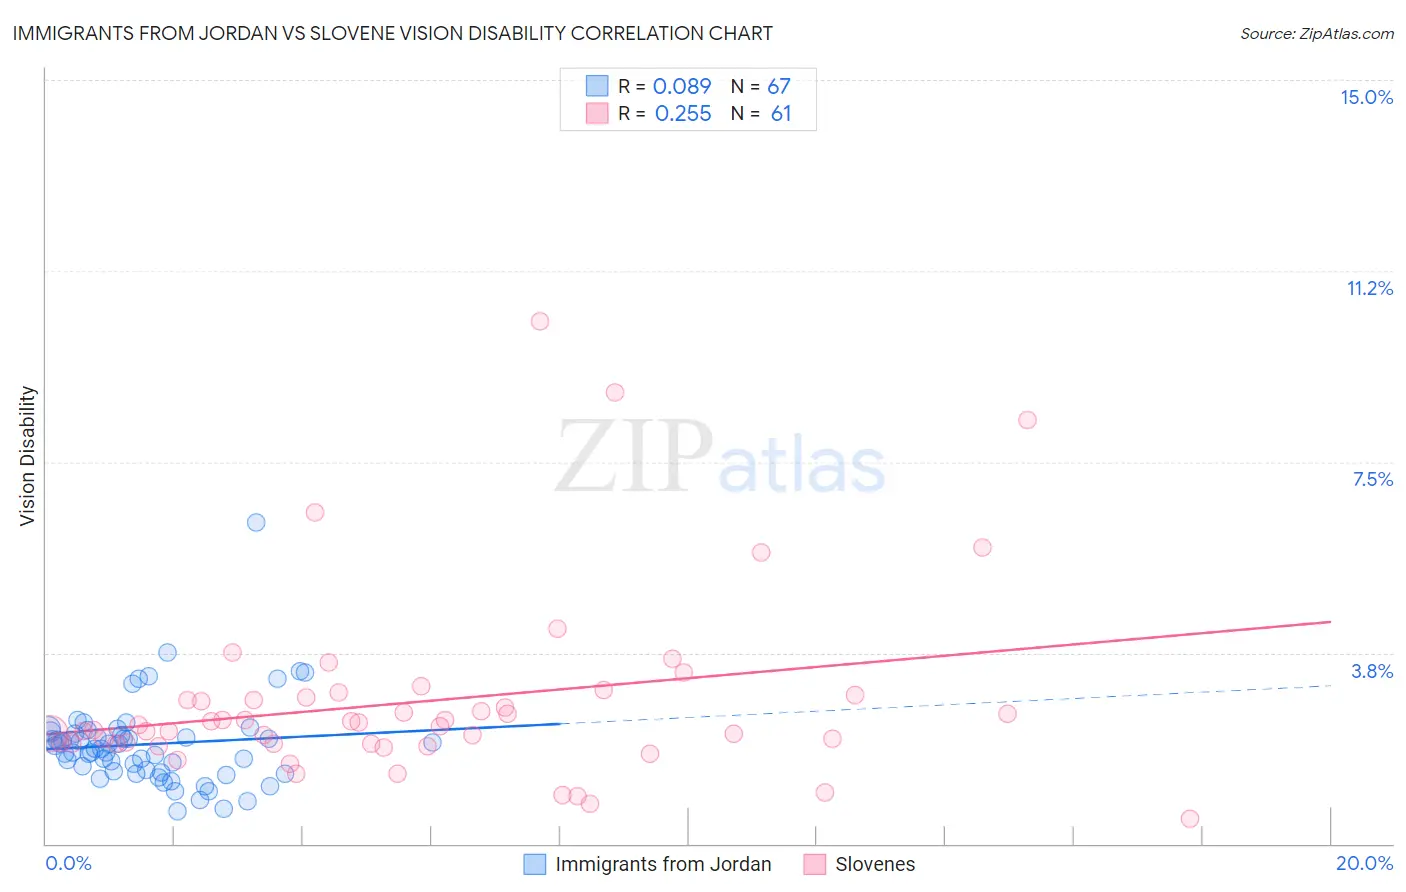
Immigrants from Jordan vs Slovene Vision Disability Correlation Chart
The statistical analysis conducted on geographies consisting of 181,247,850 people shows a slight positive correlation between the proportion of Immigrants from Jordan and percentage of population with vision disability in the United States with a correlation coefficient (R) of 0.089 and weighted average of 2.0%. Similarly, the statistical analysis conducted on geographies consisting of 261,215,676 people shows a weak positive correlation between the proportion of Slovenes and percentage of population with vision disability in the United States with a correlation coefficient (R) of 0.255 and weighted average of 2.1%, a difference of 5.1%.
Vision Disability Correlation Summary
| Measurement | Immigrants from Jordan | Slovene |
| Minimum | 0.63% | 0.49% |
| Maximum | 6.3% | 10.3% |
| Range | 5.7% | 9.8% |
| Mean | 2.0% | 2.8% |
| Median | 1.9% | 2.3% |
| Interquartile 25% (IQ1) | 1.4% | 2.0% |
| Interquartile 75% (IQ3) | 2.2% | 2.9% |
| Interquartile Range (IQR) | 0.73% | 0.94% |
| Standard Deviation (Sample) | 0.85% | 1.8% |
| Standard Deviation (Population) | 0.84% | 1.8% |
Similar Demographics by Vision Disability
Demographics Similar to Immigrants from Jordan by Vision Disability
In terms of vision disability, the demographic groups most similar to Immigrants from Jordan are Paraguayan (2.0%, a difference of 0.0%), Palestinian (2.0%, a difference of 0.020%), Immigrants from North Macedonia (2.0%, a difference of 0.020%), Immigrants from Eastern Europe (2.0%, a difference of 0.030%), and Immigrants from Eritrea (2.0%, a difference of 0.080%).
| Demographics | Rating | Rank | Vision Disability |
| Immigrants | Kazakhstan | 98.6 /100 | #70 | Exceptional 2.0% |
| Immigrants | Northern Europe | 98.6 /100 | #71 | Exceptional 2.0% |
| Immigrants | France | 98.5 /100 | #72 | Exceptional 2.0% |
| Immigrants | Eritrea | 98.4 /100 | #73 | Exceptional 2.0% |
| Palestinians | 98.3 /100 | #74 | Exceptional 2.0% |
| Immigrants | North Macedonia | 98.3 /100 | #75 | Exceptional 2.0% |
| Paraguayans | 98.3 /100 | #76 | Exceptional 2.0% |
| Immigrants | Jordan | 98.3 /100 | #77 | Exceptional 2.0% |
| Immigrants | Eastern Europe | 98.3 /100 | #78 | Exceptional 2.0% |
| Assyrians/Chaldeans/Syriacs | 98.1 /100 | #79 | Exceptional 2.0% |
| Lithuanians | 97.7 /100 | #80 | Exceptional 2.0% |
| Soviet Union | 97.6 /100 | #81 | Exceptional 2.0% |
| Immigrants | Poland | 97.6 /100 | #82 | Exceptional 2.0% |
| Immigrants | Western Asia | 97.5 /100 | #83 | Exceptional 2.0% |
| Immigrants | Latvia | 97.3 /100 | #84 | Exceptional 2.0% |
Demographics Similar to Slovenes by Vision Disability
In terms of vision disability, the demographic groups most similar to Slovenes are Immigrants from South America (2.1%, a difference of 0.010%), Immigrants from Southern Europe (2.1%, a difference of 0.080%), Immigrants from Colombia (2.1%, a difference of 0.12%), Immigrants from Norway (2.1%, a difference of 0.16%), and Pakistani (2.1%, a difference of 0.16%).
| Demographics | Rating | Rank | Vision Disability |
| Immigrants | Sudan | 78.4 /100 | #147 | Good 2.1% |
| Finns | 78.3 /100 | #148 | Good 2.1% |
| Colombians | 76.2 /100 | #149 | Good 2.1% |
| Belgians | 75.9 /100 | #150 | Good 2.1% |
| Immigrants | Norway | 75.5 /100 | #151 | Good 2.1% |
| Immigrants | Southern Europe | 74.6 /100 | #152 | Good 2.1% |
| Immigrants | South America | 73.8 /100 | #153 | Good 2.1% |
| Slovenes | 73.6 /100 | #154 | Good 2.1% |
| Immigrants | Colombia | 72.1 /100 | #155 | Good 2.1% |
| Pakistanis | 71.6 /100 | #156 | Good 2.1% |
| Serbians | 70.2 /100 | #157 | Good 2.1% |
| Immigrants | Uzbekistan | 69.9 /100 | #158 | Good 2.1% |
| South Africans | 69.8 /100 | #159 | Good 2.1% |
| Austrians | 69.0 /100 | #160 | Good 2.1% |
| Iraqis | 67.7 /100 | #161 | Good 2.1% |