Immigrants from Ireland vs Immigrants from Turkey Disability Age 18 to 34
COMPARE
Immigrants from Ireland
Immigrants from Turkey
Disability Age 18 to 34
Disability Age 18 to 34 Comparison
Immigrants from Ireland
Immigrants from Turkey
6.1%
DISABILITY AGE 18 TO 34
98.2/ 100
METRIC RATING
85th/ 347
METRIC RANK
6.1%
DISABILITY AGE 18 TO 34
99.1/ 100
METRIC RATING
75th/ 347
METRIC RANK
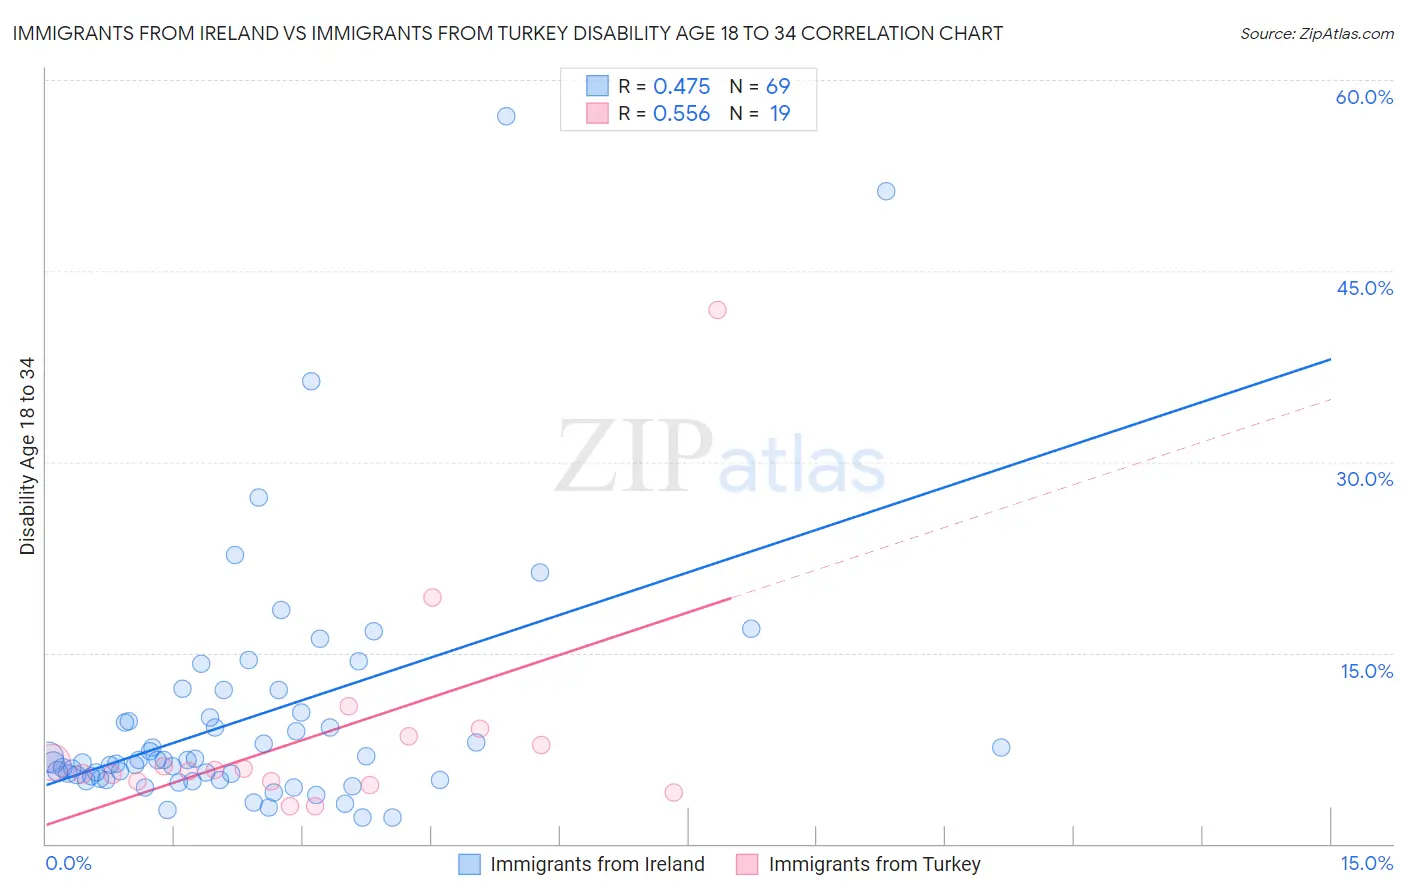
Immigrants from Ireland vs Immigrants from Turkey Disability Age 18 to 34 Correlation Chart
The statistical analysis conducted on geographies consisting of 240,370,828 people shows a moderate positive correlation between the proportion of Immigrants from Ireland and percentage of population with a disability between the ages 18 and 35 in the United States with a correlation coefficient (R) of 0.475 and weighted average of 6.1%. Similarly, the statistical analysis conducted on geographies consisting of 222,773,671 people shows a substantial positive correlation between the proportion of Immigrants from Turkey and percentage of population with a disability between the ages 18 and 35 in the United States with a correlation coefficient (R) of 0.556 and weighted average of 6.1%, a difference of 1.3%.
Disability Age 18 to 34 Correlation Summary
| Measurement | Immigrants from Ireland | Immigrants from Turkey |
| Minimum | 2.0% | 2.9% |
| Maximum | 57.1% | 42.0% |
| Range | 55.1% | 39.0% |
| Mean | 9.9% | 8.6% |
| Median | 6.6% | 5.8% |
| Interquartile 25% (IQ1) | 5.1% | 4.9% |
| Interquartile 75% (IQ3) | 10.1% | 8.4% |
| Interquartile Range (IQR) | 5.1% | 3.5% |
| Standard Deviation (Sample) | 9.8% | 8.9% |
| Standard Deviation (Population) | 9.7% | 8.6% |
Demographics Similar to Immigrants from Ireland and Immigrants from Turkey by Disability Age 18 to 34
In terms of disability age 18 to 34, the demographic groups most similar to Immigrants from Ireland are Israeli (6.1%, a difference of 0.080%), Barbadian (6.1%, a difference of 0.11%), Immigrants from Northern Africa (6.1%, a difference of 0.17%), Immigrants from Kuwait (6.2%, a difference of 0.22%), and Immigrants from Eastern Europe (6.2%, a difference of 0.30%). Similarly, the demographic groups most similar to Immigrants from Turkey are Immigrants from Western Asia (6.1%, a difference of 0.28%), Haitian (6.0%, a difference of 0.29%), Immigrants from Lebanon (6.0%, a difference of 0.38%), Cypriot (6.0%, a difference of 0.38%), and Immigrants from Russia (6.1%, a difference of 0.38%).
| Demographics | Rating | Rank | Disability Age 18 to 34 |
| Immigrants | Greece | 99.4 /100 | #70 | Exceptional 6.0% |
| Immigrants | Japan | 99.3 /100 | #71 | Exceptional 6.0% |
| Immigrants | Lebanon | 99.2 /100 | #72 | Exceptional 6.0% |
| Cypriots | 99.2 /100 | #73 | Exceptional 6.0% |
| Haitians | 99.2 /100 | #74 | Exceptional 6.0% |
| Immigrants | Turkey | 99.1 /100 | #75 | Exceptional 6.1% |
| Immigrants | Western Asia | 98.9 /100 | #76 | Exceptional 6.1% |
| Immigrants | Russia | 98.9 /100 | #77 | Exceptional 6.1% |
| Assyrians/Chaldeans/Syriacs | 98.9 /100 | #78 | Exceptional 6.1% |
| Afghans | 98.7 /100 | #79 | Exceptional 6.1% |
| Immigrants | Chile | 98.5 /100 | #80 | Exceptional 6.1% |
| Immigrants | Australia | 98.5 /100 | #81 | Exceptional 6.1% |
| Immigrants | Northern Africa | 98.4 /100 | #82 | Exceptional 6.1% |
| Barbadians | 98.3 /100 | #83 | Exceptional 6.1% |
| Israelis | 98.3 /100 | #84 | Exceptional 6.1% |
| Immigrants | Ireland | 98.2 /100 | #85 | Exceptional 6.1% |
| Immigrants | Kuwait | 98.0 /100 | #86 | Exceptional 6.2% |
| Immigrants | Eastern Europe | 97.9 /100 | #87 | Exceptional 6.2% |
| Cambodians | 97.8 /100 | #88 | Exceptional 6.2% |
| Turks | 97.8 /100 | #89 | Exceptional 6.2% |
| Immigrants | Vietnam | 97.7 /100 | #90 | Exceptional 6.2% |