Immigrants from Indonesia vs Immigrants from Oceania Disability Age 18 to 34
COMPARE
Immigrants from Indonesia
Immigrants from Oceania
Disability Age 18 to 34
Disability Age 18 to 34 Comparison
Immigrants from Indonesia
Immigrants from Oceania
5.9%
DISABILITY AGE 18 TO 34
99.7/ 100
METRIC RATING
53rd/ 347
METRIC RANK
6.7%
DISABILITY AGE 18 TO 34
35.4/ 100
METRIC RATING
185th/ 347
METRIC RANK
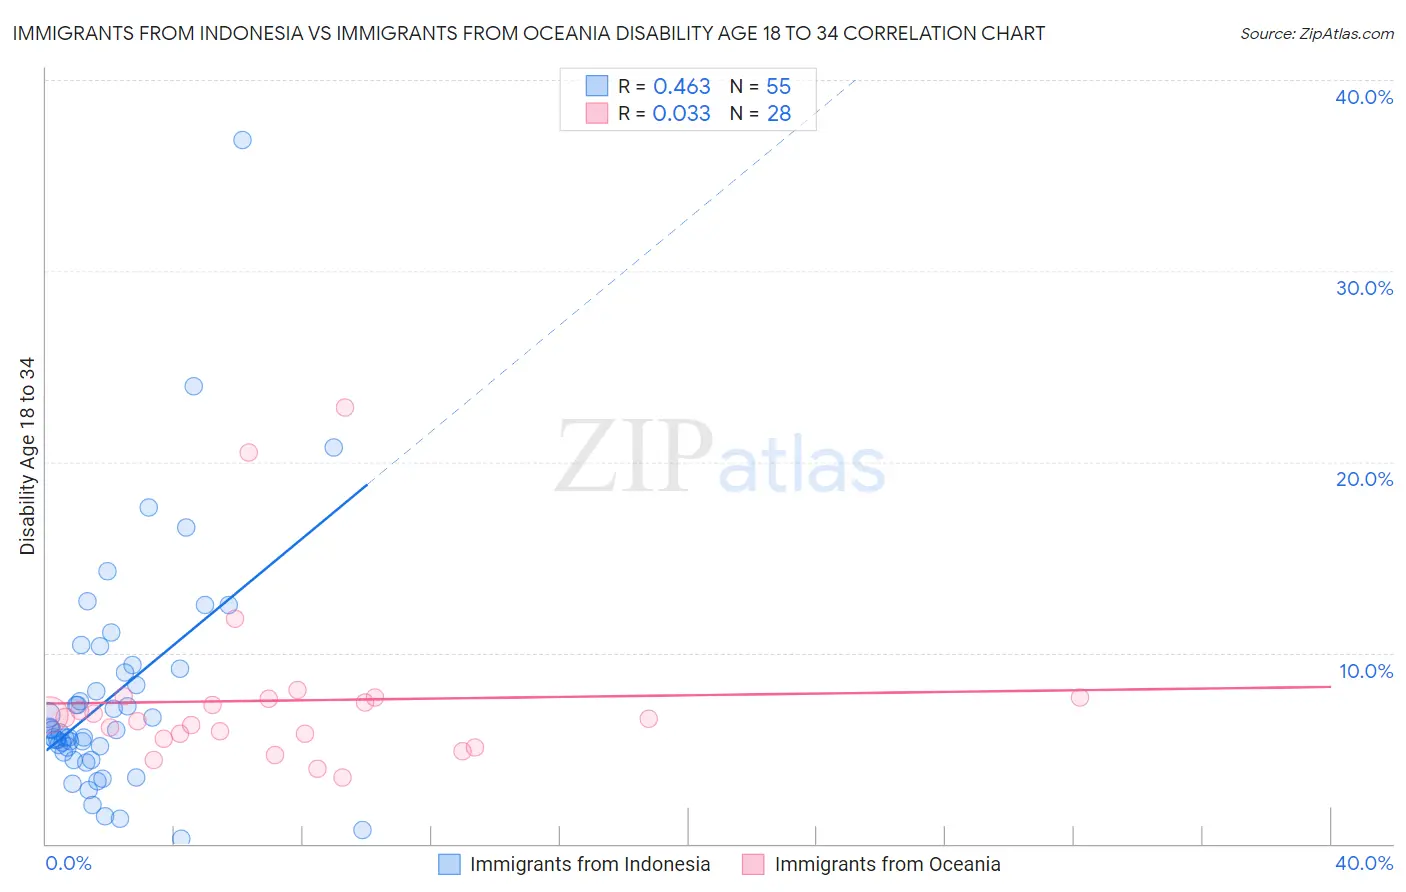
Immigrants from Indonesia vs Immigrants from Oceania Disability Age 18 to 34 Correlation Chart
The statistical analysis conducted on geographies consisting of 215,585,234 people shows a moderate positive correlation between the proportion of Immigrants from Indonesia and percentage of population with a disability between the ages 18 and 35 in the United States with a correlation coefficient (R) of 0.463 and weighted average of 5.9%. Similarly, the statistical analysis conducted on geographies consisting of 304,887,446 people shows no correlation between the proportion of Immigrants from Oceania and percentage of population with a disability between the ages 18 and 35 in the United States with a correlation coefficient (R) of 0.033 and weighted average of 6.7%, a difference of 12.5%.
Disability Age 18 to 34 Correlation Summary
| Measurement | Immigrants from Indonesia | Immigrants from Oceania |
| Minimum | 0.29% | 3.5% |
| Maximum | 36.9% | 22.9% |
| Range | 36.6% | 19.4% |
| Mean | 7.8% | 7.5% |
| Median | 6.0% | 6.6% |
| Interquartile 25% (IQ1) | 4.8% | 5.6% |
| Interquartile 75% (IQ3) | 9.2% | 7.6% |
| Interquartile Range (IQR) | 4.4% | 2.0% |
| Standard Deviation (Sample) | 6.2% | 4.3% |
| Standard Deviation (Population) | 6.1% | 4.2% |
Similar Demographics by Disability Age 18 to 34
Demographics Similar to Immigrants from Indonesia by Disability Age 18 to 34
In terms of disability age 18 to 34, the demographic groups most similar to Immigrants from Indonesia are Immigrants from Malaysia (5.9%, a difference of 0.050%), Immigrants from Spain (5.9%, a difference of 0.060%), Okinawan (5.9%, a difference of 0.14%), Paraguayan (5.9%, a difference of 0.22%), and Immigrants from El Salvador (5.9%, a difference of 0.28%).
| Demographics | Rating | Rank | Disability Age 18 to 34 |
| Immigrants | Korea | 99.8 /100 | #46 | Exceptional 5.9% |
| Immigrants | Egypt | 99.8 /100 | #47 | Exceptional 5.9% |
| Immigrants | Trinidad and Tobago | 99.8 /100 | #48 | Exceptional 5.9% |
| Immigrants | Belarus | 99.8 /100 | #49 | Exceptional 5.9% |
| Immigrants | El Salvador | 99.8 /100 | #50 | Exceptional 5.9% |
| Egyptians | 99.8 /100 | #51 | Exceptional 5.9% |
| Okinawans | 99.7 /100 | #52 | Exceptional 5.9% |
| Immigrants | Indonesia | 99.7 /100 | #53 | Exceptional 5.9% |
| Immigrants | Malaysia | 99.7 /100 | #54 | Exceptional 5.9% |
| Immigrants | Spain | 99.7 /100 | #55 | Exceptional 5.9% |
| Paraguayans | 99.7 /100 | #56 | Exceptional 5.9% |
| Immigrants | Haiti | 99.7 /100 | #57 | Exceptional 5.9% |
| Immigrants | Serbia | 99.7 /100 | #58 | Exceptional 5.9% |
| Immigrants | Caribbean | 99.6 /100 | #59 | Exceptional 6.0% |
| Immigrants | Sri Lanka | 99.6 /100 | #60 | Exceptional 6.0% |
Demographics Similar to Immigrants from Oceania by Disability Age 18 to 34
In terms of disability age 18 to 34, the demographic groups most similar to Immigrants from Oceania are Yup'ik (6.7%, a difference of 0.0%), Maltese (6.7%, a difference of 0.040%), Immigrants from Cameroon (6.7%, a difference of 0.070%), Pakistani (6.7%, a difference of 0.13%), and Immigrants from Zimbabwe (6.7%, a difference of 0.13%).
| Demographics | Rating | Rank | Disability Age 18 to 34 |
| Nigerians | 43.7 /100 | #178 | Average 6.6% |
| Immigrants | Ghana | 42.1 /100 | #179 | Average 6.6% |
| Immigrants | Austria | 39.6 /100 | #180 | Fair 6.6% |
| Romanians | 39.5 /100 | #181 | Fair 6.6% |
| U.S. Virgin Islanders | 38.6 /100 | #182 | Fair 6.7% |
| Immigrants | Iraq | 37.4 /100 | #183 | Fair 6.7% |
| Iraqis | 37.4 /100 | #184 | Fair 6.7% |
| Immigrants | Oceania | 35.4 /100 | #185 | Fair 6.7% |
| Yup'ik | 35.3 /100 | #186 | Fair 6.7% |
| Maltese | 34.8 /100 | #187 | Fair 6.7% |
| Immigrants | Cameroon | 34.5 /100 | #188 | Fair 6.7% |
| Pakistanis | 33.7 /100 | #189 | Fair 6.7% |
| Immigrants | Zimbabwe | 33.6 /100 | #190 | Fair 6.7% |
| Immigrants | Eastern Africa | 33.2 /100 | #191 | Fair 6.7% |
| Immigrants | Western Africa | 28.3 /100 | #192 | Fair 6.7% |