Immigrants from India vs Immigrants from Iran Disability Age 18 to 34
COMPARE
Immigrants from India
Immigrants from Iran
Disability Age 18 to 34
Disability Age 18 to 34 Comparison
Immigrants from India
Immigrants from Iran
5.6%
DISABILITY AGE 18 TO 34
100.0/ 100
METRIC RATING
15th/ 347
METRIC RANK
5.5%
DISABILITY AGE 18 TO 34
100.0/ 100
METRIC RATING
13th/ 347
METRIC RANK
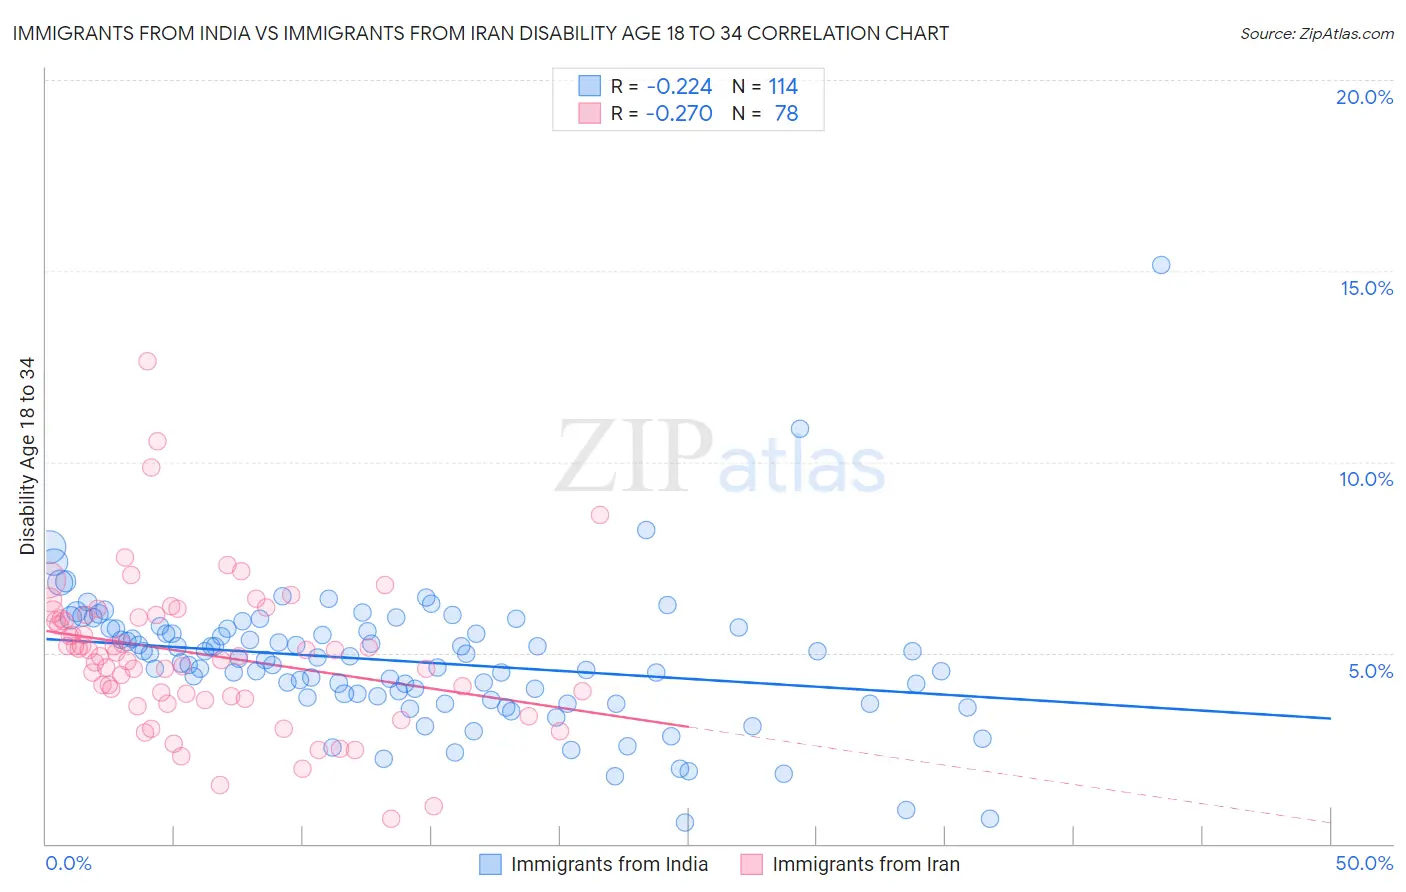
Immigrants from India vs Immigrants from Iran Disability Age 18 to 34 Correlation Chart
The statistical analysis conducted on geographies consisting of 433,147,761 people shows a weak negative correlation between the proportion of Immigrants from India and percentage of population with a disability between the ages 18 and 35 in the United States with a correlation coefficient (R) of -0.224 and weighted average of 5.6%. Similarly, the statistical analysis conducted on geographies consisting of 279,551,926 people shows a weak negative correlation between the proportion of Immigrants from Iran and percentage of population with a disability between the ages 18 and 35 in the United States with a correlation coefficient (R) of -0.270 and weighted average of 5.5%, a difference of 0.53%.
Disability Age 18 to 34 Correlation Summary
| Measurement | Immigrants from India | Immigrants from Iran |
| Minimum | 0.57% | 0.66% |
| Maximum | 15.2% | 12.6% |
| Range | 14.6% | 12.0% |
| Mean | 4.8% | 5.0% |
| Median | 4.9% | 5.0% |
| Interquartile 25% (IQ1) | 3.8% | 3.9% |
| Interquartile 75% (IQ3) | 5.6% | 6.0% |
| Interquartile Range (IQR) | 1.8% | 2.1% |
| Standard Deviation (Sample) | 1.8% | 2.0% |
| Standard Deviation (Population) | 1.8% | 2.0% |
Demographics Similar to Immigrants from India and Immigrants from Iran by Disability Age 18 to 34
In terms of disability age 18 to 34, the demographic groups most similar to Immigrants from India are Immigrants from Israel (5.6%, a difference of 0.030%), Immigrants from Eastern Asia (5.6%, a difference of 0.20%), Indian (Asian) (5.5%, a difference of 0.38%), Immigrants from St. Vincent and the Grenadines (5.5%, a difference of 0.85%), and Vietnamese (5.5%, a difference of 0.91%). Similarly, the demographic groups most similar to Immigrants from Iran are Indian (Asian) (5.5%, a difference of 0.15%), Immigrants from St. Vincent and the Grenadines (5.5%, a difference of 0.32%), Vietnamese (5.5%, a difference of 0.38%), Immigrants from Uzbekistan (5.5%, a difference of 0.45%), and Immigrants from Israel (5.6%, a difference of 0.56%).
| Demographics | Rating | Rank | Disability Age 18 to 34 |
| Immigrants | Cuba | 100.0 /100 | #4 | Exceptional 5.4% |
| Immigrants | Taiwan | 100.0 /100 | #5 | Exceptional 5.4% |
| Filipinos | 100.0 /100 | #6 | Exceptional 5.4% |
| Immigrants | China | 100.0 /100 | #7 | Exceptional 5.4% |
| Immigrants | Guyana | 100.0 /100 | #8 | Exceptional 5.5% |
| Guyanese | 100.0 /100 | #9 | Exceptional 5.5% |
| Immigrants | Uzbekistan | 100.0 /100 | #10 | Exceptional 5.5% |
| Vietnamese | 100.0 /100 | #11 | Exceptional 5.5% |
| Immigrants | St. Vincent and the Grenadines | 100.0 /100 | #12 | Exceptional 5.5% |
| Immigrants | Iran | 100.0 /100 | #13 | Exceptional 5.5% |
| Indians (Asian) | 100.0 /100 | #14 | Exceptional 5.5% |
| Immigrants | India | 100.0 /100 | #15 | Exceptional 5.6% |
| Immigrants | Israel | 100.0 /100 | #16 | Exceptional 5.6% |
| Immigrants | Eastern Asia | 100.0 /100 | #17 | Exceptional 5.6% |
| Immigrants | Bolivia | 100.0 /100 | #18 | Exceptional 5.6% |
| Thais | 100.0 /100 | #19 | Exceptional 5.6% |
| Immigrants | Bangladesh | 100.0 /100 | #20 | Exceptional 5.6% |
| Immigrants | South Central Asia | 100.0 /100 | #21 | Exceptional 5.7% |
| Immigrants | Nicaragua | 100.0 /100 | #22 | Exceptional 5.7% |
| Cubans | 100.0 /100 | #23 | Exceptional 5.7% |
| Immigrants | Argentina | 100.0 /100 | #24 | Exceptional 5.7% |