Immigrants from Hungary vs Crow Disability Age 18 to 34
COMPARE
Immigrants from Hungary
Crow
Disability Age 18 to 34
Disability Age 18 to 34 Comparison
Immigrants from Hungary
Crow
6.5%
DISABILITY AGE 18 TO 34
69.6/ 100
METRIC RATING
165th/ 347
METRIC RANK
8.3%
DISABILITY AGE 18 TO 34
0.0/ 100
METRIC RATING
329th/ 347
METRIC RANK
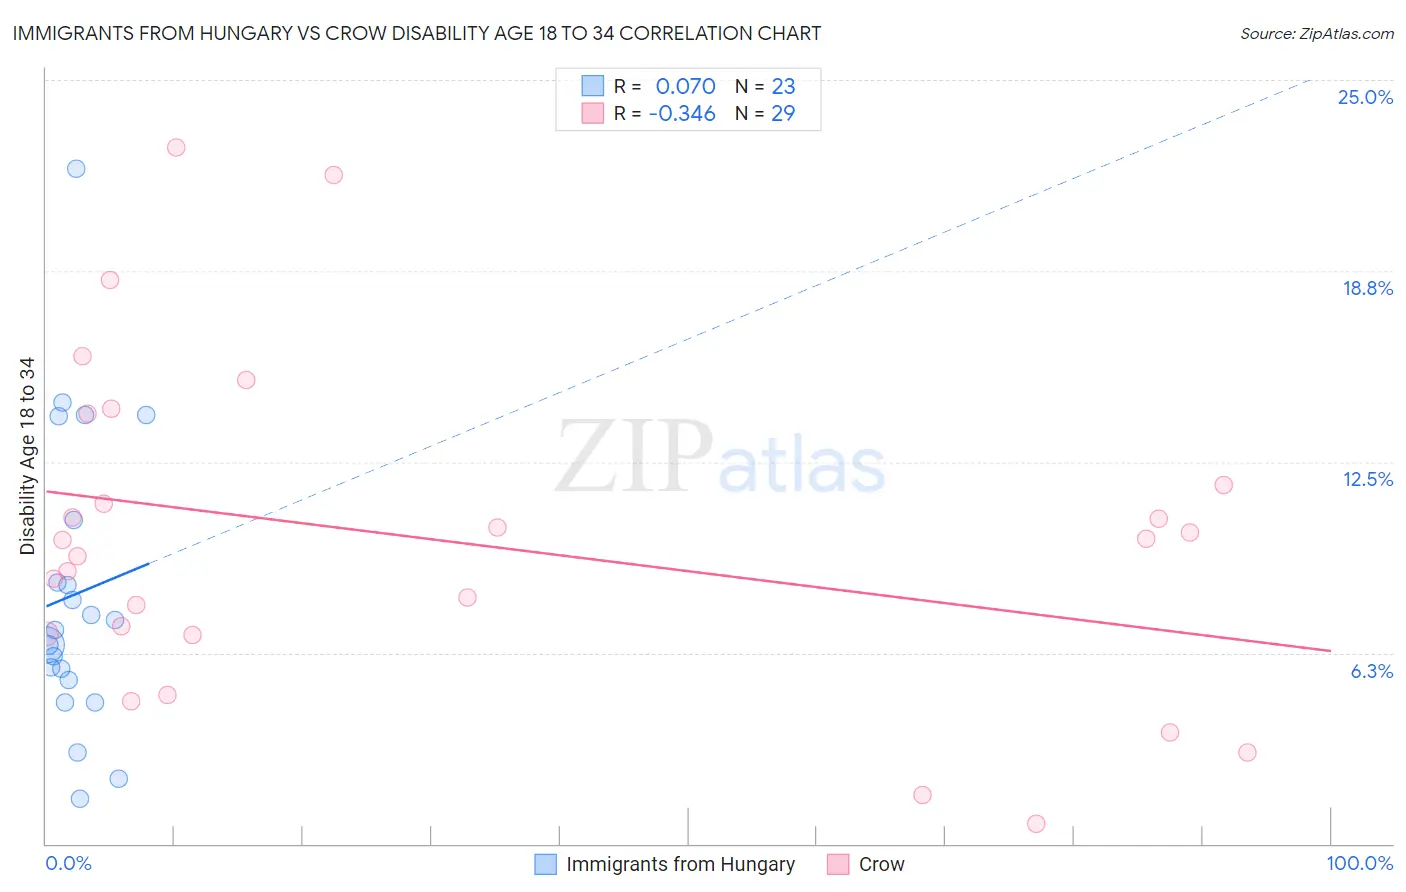
Immigrants from Hungary vs Crow Disability Age 18 to 34 Correlation Chart
The statistical analysis conducted on geographies consisting of 195,414,358 people shows a slight positive correlation between the proportion of Immigrants from Hungary and percentage of population with a disability between the ages 18 and 35 in the United States with a correlation coefficient (R) of 0.070 and weighted average of 6.5%. Similarly, the statistical analysis conducted on geographies consisting of 59,180,279 people shows a mild negative correlation between the proportion of Crow and percentage of population with a disability between the ages 18 and 35 in the United States with a correlation coefficient (R) of -0.346 and weighted average of 8.3%, a difference of 27.2%.
Disability Age 18 to 34 Correlation Summary
| Measurement | Immigrants from Hungary | Crow |
| Minimum | 1.5% | 0.66% |
| Maximum | 22.1% | 22.8% |
| Range | 20.6% | 22.1% |
| Mean | 8.2% | 10.0% |
| Median | 7.0% | 10.0% |
| Interquartile 25% (IQ1) | 5.4% | 6.8% |
| Interquartile 75% (IQ3) | 10.6% | 12.9% |
| Interquartile Range (IQR) | 5.2% | 6.1% |
| Standard Deviation (Sample) | 4.8% | 5.4% |
| Standard Deviation (Population) | 4.7% | 5.3% |
Similar Demographics by Disability Age 18 to 34
Demographics Similar to Immigrants from Hungary by Disability Age 18 to 34
In terms of disability age 18 to 34, the demographic groups most similar to Immigrants from Hungary are Immigrants from Nigeria (6.5%, a difference of 0.060%), South African (6.5%, a difference of 0.17%), Immigrants from Denmark (6.5%, a difference of 0.17%), Arab (6.5%, a difference of 0.23%), and Immigrants from Southern Europe (6.5%, a difference of 0.25%).
| Demographics | Rating | Rank | Disability Age 18 to 34 |
| Zimbabweans | 74.7 /100 | #158 | Good 6.5% |
| Dominicans | 73.6 /100 | #159 | Good 6.5% |
| Immigrants | Southern Europe | 72.5 /100 | #160 | Good 6.5% |
| Arabs | 72.3 /100 | #161 | Good 6.5% |
| South Africans | 71.7 /100 | #162 | Good 6.5% |
| Immigrants | Denmark | 71.7 /100 | #163 | Good 6.5% |
| Immigrants | Nigeria | 70.4 /100 | #164 | Good 6.5% |
| Immigrants | Hungary | 69.6 /100 | #165 | Good 6.5% |
| Eastern Europeans | 65.1 /100 | #166 | Good 6.5% |
| Immigrants | Northern Europe | 64.1 /100 | #167 | Good 6.5% |
| Immigrants | Moldova | 63.1 /100 | #168 | Good 6.5% |
| Russians | 60.2 /100 | #169 | Good 6.5% |
| Immigrants | Bahamas | 57.9 /100 | #170 | Average 6.6% |
| Bahamians | 55.5 /100 | #171 | Average 6.6% |
| Ghanaians | 54.7 /100 | #172 | Average 6.6% |
Demographics Similar to Crow by Disability Age 18 to 34
In terms of disability age 18 to 34, the demographic groups most similar to Crow are Osage (8.3%, a difference of 0.25%), Comanche (8.3%, a difference of 0.44%), Delaware (8.2%, a difference of 0.52%), Sioux (8.2%, a difference of 0.57%), and Puget Sound Salish (8.3%, a difference of 0.66%).
| Demographics | Rating | Rank | Disability Age 18 to 34 |
| Cree | 0.0 /100 | #322 | Tragic 8.1% |
| French American Indians | 0.0 /100 | #323 | Tragic 8.2% |
| Cajuns | 0.0 /100 | #324 | Tragic 8.2% |
| Natives/Alaskans | 0.0 /100 | #325 | Tragic 8.2% |
| Potawatomi | 0.0 /100 | #326 | Tragic 8.2% |
| Sioux | 0.0 /100 | #327 | Tragic 8.2% |
| Delaware | 0.0 /100 | #328 | Tragic 8.2% |
| Crow | 0.0 /100 | #329 | Tragic 8.3% |
| Osage | 0.0 /100 | #330 | Tragic 8.3% |
| Comanche | 0.0 /100 | #331 | Tragic 8.3% |
| Puget Sound Salish | 0.0 /100 | #332 | Tragic 8.3% |
| Apache | 0.0 /100 | #333 | Tragic 8.4% |
| Dutch West Indians | 0.0 /100 | #334 | Tragic 8.4% |
| Seminole | 0.0 /100 | #335 | Tragic 8.4% |
| Immigrants | Azores | 0.0 /100 | #336 | Tragic 8.5% |