Immigrants from Hong Kong vs Northern European Disability Age 18 to 34
COMPARE
Immigrants from Hong Kong
Northern European
Disability Age 18 to 34
Disability Age 18 to 34 Comparison
Immigrants from Hong Kong
Northern Europeans
5.2%
DISABILITY AGE 18 TO 34
100.0/ 100
METRIC RATING
2nd/ 347
METRIC RANK
7.3%
DISABILITY AGE 18 TO 34
0.2/ 100
METRIC RATING
261st/ 347
METRIC RANK
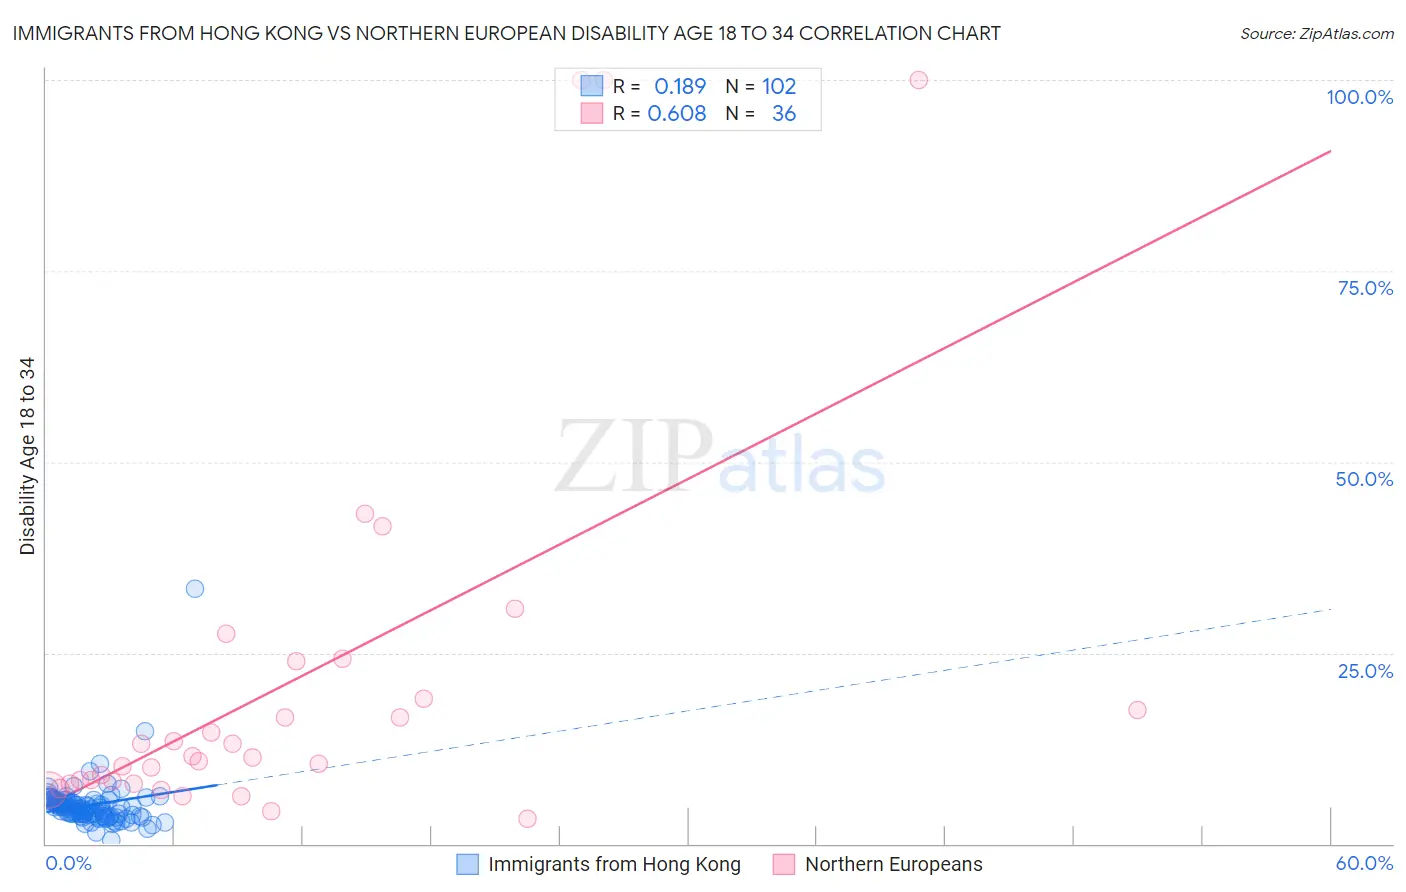
Immigrants from Hong Kong vs Northern European Disability Age 18 to 34 Correlation Chart
The statistical analysis conducted on geographies consisting of 253,676,267 people shows a poor positive correlation between the proportion of Immigrants from Hong Kong and percentage of population with a disability between the ages 18 and 35 in the United States with a correlation coefficient (R) of 0.189 and weighted average of 5.2%. Similarly, the statistical analysis conducted on geographies consisting of 404,691,388 people shows a significant positive correlation between the proportion of Northern Europeans and percentage of population with a disability between the ages 18 and 35 in the United States with a correlation coefficient (R) of 0.608 and weighted average of 7.3%, a difference of 40.1%.
Disability Age 18 to 34 Correlation Summary
| Measurement | Immigrants from Hong Kong | Northern European |
| Minimum | 0.51% | 3.3% |
| Maximum | 33.3% | 100.0% |
| Range | 32.8% | 96.7% |
| Mean | 5.0% | 21.4% |
| Median | 4.7% | 11.4% |
| Interquartile 25% (IQ1) | 3.8% | 8.0% |
| Interquartile 75% (IQ3) | 5.6% | 21.4% |
| Interquartile Range (IQR) | 1.9% | 13.4% |
| Standard Deviation (Sample) | 3.4% | 25.8% |
| Standard Deviation (Population) | 3.3% | 25.4% |
Similar Demographics by Disability Age 18 to 34
Demographics Similar to Immigrants from Hong Kong by Disability Age 18 to 34
In terms of disability age 18 to 34, the demographic groups most similar to Immigrants from Hong Kong are Immigrants from Grenada (5.3%, a difference of 2.2%), Immigrants from Cuba (5.4%, a difference of 2.8%), Immigrants from Taiwan (5.4%, a difference of 3.1%), Immigrants from Armenia (5.0%, a difference of 4.3%), and Filipino (5.4%, a difference of 4.4%).
| Demographics | Rating | Rank | Disability Age 18 to 34 |
| Immigrants | Armenia | 100.0 /100 | #1 | Exceptional 5.0% |
| Immigrants | Hong Kong | 100.0 /100 | #2 | Exceptional 5.2% |
| Immigrants | Grenada | 100.0 /100 | #3 | Exceptional 5.3% |
| Immigrants | Cuba | 100.0 /100 | #4 | Exceptional 5.4% |
| Immigrants | Taiwan | 100.0 /100 | #5 | Exceptional 5.4% |
| Filipinos | 100.0 /100 | #6 | Exceptional 5.4% |
| Immigrants | China | 100.0 /100 | #7 | Exceptional 5.4% |
| Immigrants | Guyana | 100.0 /100 | #8 | Exceptional 5.5% |
| Guyanese | 100.0 /100 | #9 | Exceptional 5.5% |
| Immigrants | Uzbekistan | 100.0 /100 | #10 | Exceptional 5.5% |
| Vietnamese | 100.0 /100 | #11 | Exceptional 5.5% |
| Immigrants | St. Vincent and the Grenadines | 100.0 /100 | #12 | Exceptional 5.5% |
| Immigrants | Iran | 100.0 /100 | #13 | Exceptional 5.5% |
| Indians (Asian) | 100.0 /100 | #14 | Exceptional 5.5% |
| Immigrants | India | 100.0 /100 | #15 | Exceptional 5.6% |
Demographics Similar to Northern Europeans by Disability Age 18 to 34
In terms of disability age 18 to 34, the demographic groups most similar to Northern Europeans are Canadian (7.3%, a difference of 0.030%), Tohono O'odham (7.3%, a difference of 0.17%), Somali (7.3%, a difference of 0.23%), Immigrants from Micronesia (7.3%, a difference of 0.30%), and British (7.3%, a difference of 0.32%).
| Demographics | Rating | Rank | Disability Age 18 to 34 |
| Indonesians | 0.4 /100 | #254 | Tragic 7.2% |
| Immigrants | Germany | 0.4 /100 | #255 | Tragic 7.2% |
| Immigrants | Laos | 0.4 /100 | #256 | Tragic 7.2% |
| Czechs | 0.3 /100 | #257 | Tragic 7.2% |
| Immigrants | Micronesia | 0.3 /100 | #258 | Tragic 7.3% |
| Somalis | 0.2 /100 | #259 | Tragic 7.3% |
| Tohono O'odham | 0.2 /100 | #260 | Tragic 7.3% |
| Northern Europeans | 0.2 /100 | #261 | Tragic 7.3% |
| Canadians | 0.2 /100 | #262 | Tragic 7.3% |
| British | 0.2 /100 | #263 | Tragic 7.3% |
| Bermudans | 0.1 /100 | #264 | Tragic 7.3% |
| Slovenes | 0.1 /100 | #265 | Tragic 7.3% |
| German Russians | 0.1 /100 | #266 | Tragic 7.4% |
| Bangladeshis | 0.1 /100 | #267 | Tragic 7.4% |
| Portuguese | 0.1 /100 | #268 | Tragic 7.4% |