Immigrants from Fiji vs Immigrants from Asia Disability Age 35 to 64
COMPARE
Immigrants from Fiji
Immigrants from Asia
Disability Age 35 to 64
Disability Age 35 to 64 Comparison
Immigrants from Fiji
Immigrants from Asia
11.3%
DISABILITY AGE 35 TO 64
50.0/ 100
METRIC RATING
174th/ 347
METRIC RANK
9.5%
DISABILITY AGE 35 TO 64
100.0/ 100
METRIC RATING
27th/ 347
METRIC RANK
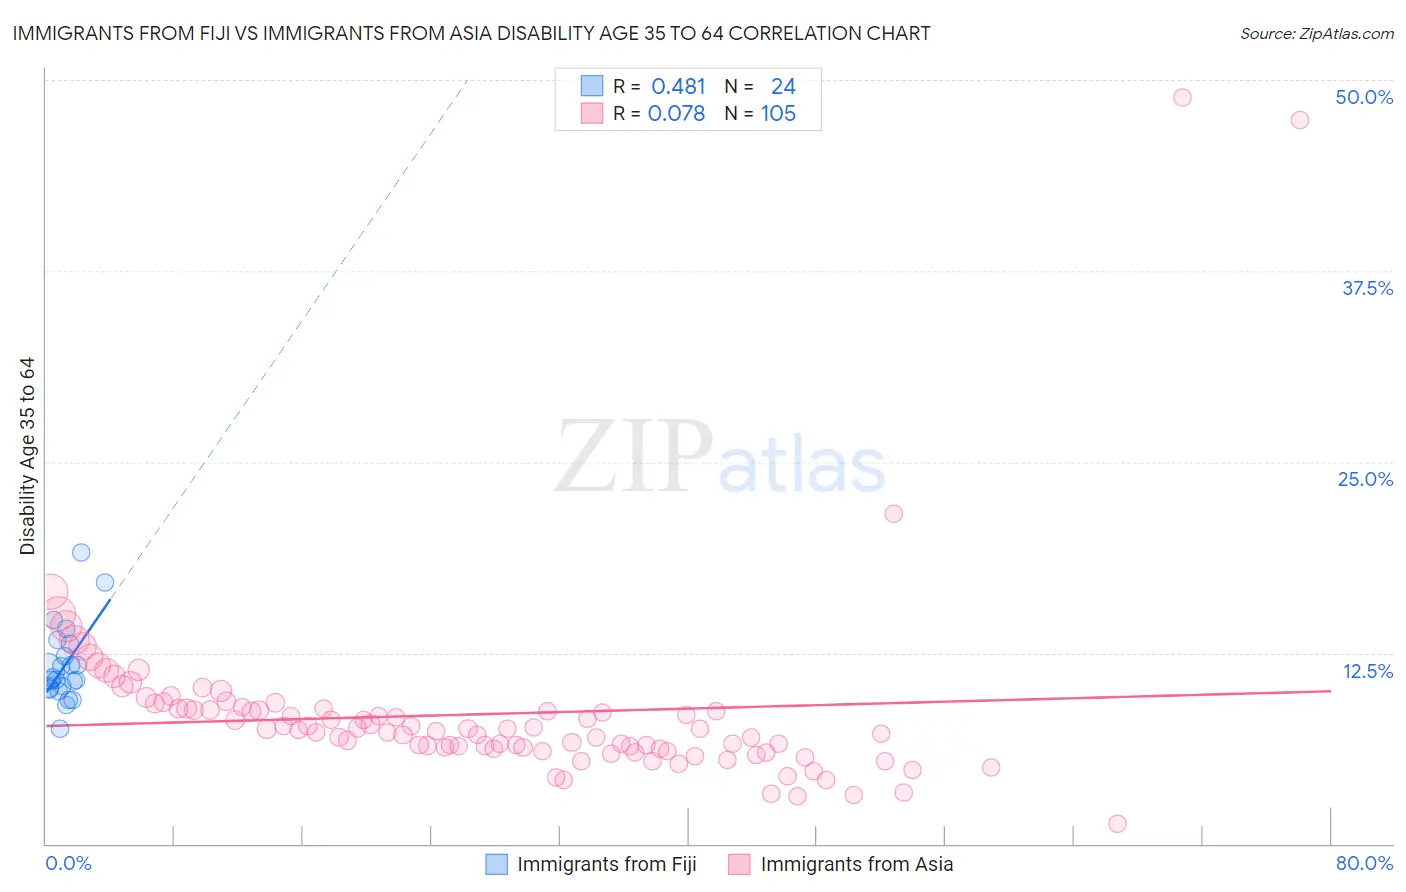
Immigrants from Fiji vs Immigrants from Asia Disability Age 35 to 64 Correlation Chart
The statistical analysis conducted on geographies consisting of 93,753,522 people shows a moderate positive correlation between the proportion of Immigrants from Fiji and percentage of population with a disability between the ages 34 and 64 in the United States with a correlation coefficient (R) of 0.481 and weighted average of 11.3%. Similarly, the statistical analysis conducted on geographies consisting of 548,275,294 people shows a slight positive correlation between the proportion of Immigrants from Asia and percentage of population with a disability between the ages 34 and 64 in the United States with a correlation coefficient (R) of 0.078 and weighted average of 9.5%, a difference of 18.9%.
Disability Age 35 to 64 Correlation Summary
| Measurement | Immigrants from Fiji | Immigrants from Asia |
| Minimum | 7.6% | 1.3% |
| Maximum | 19.1% | 48.8% |
| Range | 11.5% | 47.6% |
| Mean | 11.7% | 8.5% |
| Median | 10.8% | 7.5% |
| Interquartile 25% (IQ1) | 10.2% | 6.2% |
| Interquartile 75% (IQ3) | 12.7% | 8.8% |
| Interquartile Range (IQR) | 2.5% | 2.6% |
| Standard Deviation (Sample) | 2.6% | 6.2% |
| Standard Deviation (Population) | 2.5% | 6.2% |
Similar Demographics by Disability Age 35 to 64
Demographics Similar to Immigrants from Fiji by Disability Age 35 to 64
In terms of disability age 35 to 64, the demographic groups most similar to Immigrants from Fiji are Lebanese (11.3%, a difference of 0.14%), Czech (11.3%, a difference of 0.17%), Italian (11.2%, a difference of 0.46%), Immigrants from Trinidad and Tobago (11.2%, a difference of 0.48%), and Ugandan (11.3%, a difference of 0.51%).
| Demographics | Rating | Rank | Disability Age 35 to 64 |
| Austrians | 63.2 /100 | #167 | Good 11.1% |
| Central Americans | 59.1 /100 | #168 | Average 11.2% |
| Haitians | 59.0 /100 | #169 | Average 11.2% |
| Immigrants | Uganda | 58.0 /100 | #170 | Average 11.2% |
| Immigrants | Trinidad and Tobago | 55.9 /100 | #171 | Average 11.2% |
| Italians | 55.6 /100 | #172 | Average 11.2% |
| Lebanese | 51.8 /100 | #173 | Average 11.3% |
| Immigrants | Fiji | 50.0 /100 | #174 | Average 11.3% |
| Czechs | 47.9 /100 | #175 | Average 11.3% |
| Ugandans | 43.7 /100 | #176 | Average 11.3% |
| Immigrants | Eastern Africa | 42.2 /100 | #177 | Average 11.3% |
| Poles | 42.0 /100 | #178 | Average 11.3% |
| Immigrants | Barbados | 41.6 /100 | #179 | Average 11.3% |
| Immigrants | Caribbean | 41.5 /100 | #180 | Average 11.3% |
| Trinidadians and Tobagonians | 40.8 /100 | #181 | Average 11.4% |
Demographics Similar to Immigrants from Asia by Disability Age 35 to 64
In terms of disability age 35 to 64, the demographic groups most similar to Immigrants from Asia are Immigrants from Pakistan (9.5%, a difference of 0.17%), Immigrants from Sri Lanka (9.5%, a difference of 0.22%), Immigrants from Ireland (9.5%, a difference of 0.62%), Immigrants from Japan (9.5%, a difference of 0.66%), and Venezuelan (9.4%, a difference of 0.72%).
| Demographics | Rating | Rank | Disability Age 35 to 64 |
| Immigrants | Argentina | 100.0 /100 | #20 | Exceptional 9.3% |
| Okinawans | 100.0 /100 | #21 | Exceptional 9.4% |
| Cypriots | 100.0 /100 | #22 | Exceptional 9.4% |
| Argentineans | 100.0 /100 | #23 | Exceptional 9.4% |
| Asians | 100.0 /100 | #24 | Exceptional 9.4% |
| Venezuelans | 100.0 /100 | #25 | Exceptional 9.4% |
| Immigrants | Sri Lanka | 100.0 /100 | #26 | Exceptional 9.5% |
| Immigrants | Asia | 100.0 /100 | #27 | Exceptional 9.5% |
| Immigrants | Pakistan | 100.0 /100 | #28 | Exceptional 9.5% |
| Immigrants | Ireland | 100.0 /100 | #29 | Exceptional 9.5% |
| Immigrants | Japan | 100.0 /100 | #30 | Exceptional 9.5% |
| Immigrants | Lithuania | 99.9 /100 | #31 | Exceptional 9.6% |
| Turks | 99.9 /100 | #32 | Exceptional 9.7% |
| Immigrants | Indonesia | 99.9 /100 | #33 | Exceptional 9.7% |
| Immigrants | Australia | 99.9 /100 | #34 | Exceptional 9.7% |