Immigrants from Europe vs Immigrants from Denmark Disability Age 18 to 34
COMPARE
Immigrants from Europe
Immigrants from Denmark
Disability Age 18 to 34
Disability Age 18 to 34 Comparison
Immigrants from Europe
Immigrants from Denmark
6.4%
DISABILITY AGE 18 TO 34
88.8/ 100
METRIC RATING
134th/ 347
METRIC RANK
6.5%
DISABILITY AGE 18 TO 34
71.7/ 100
METRIC RATING
163rd/ 347
METRIC RANK
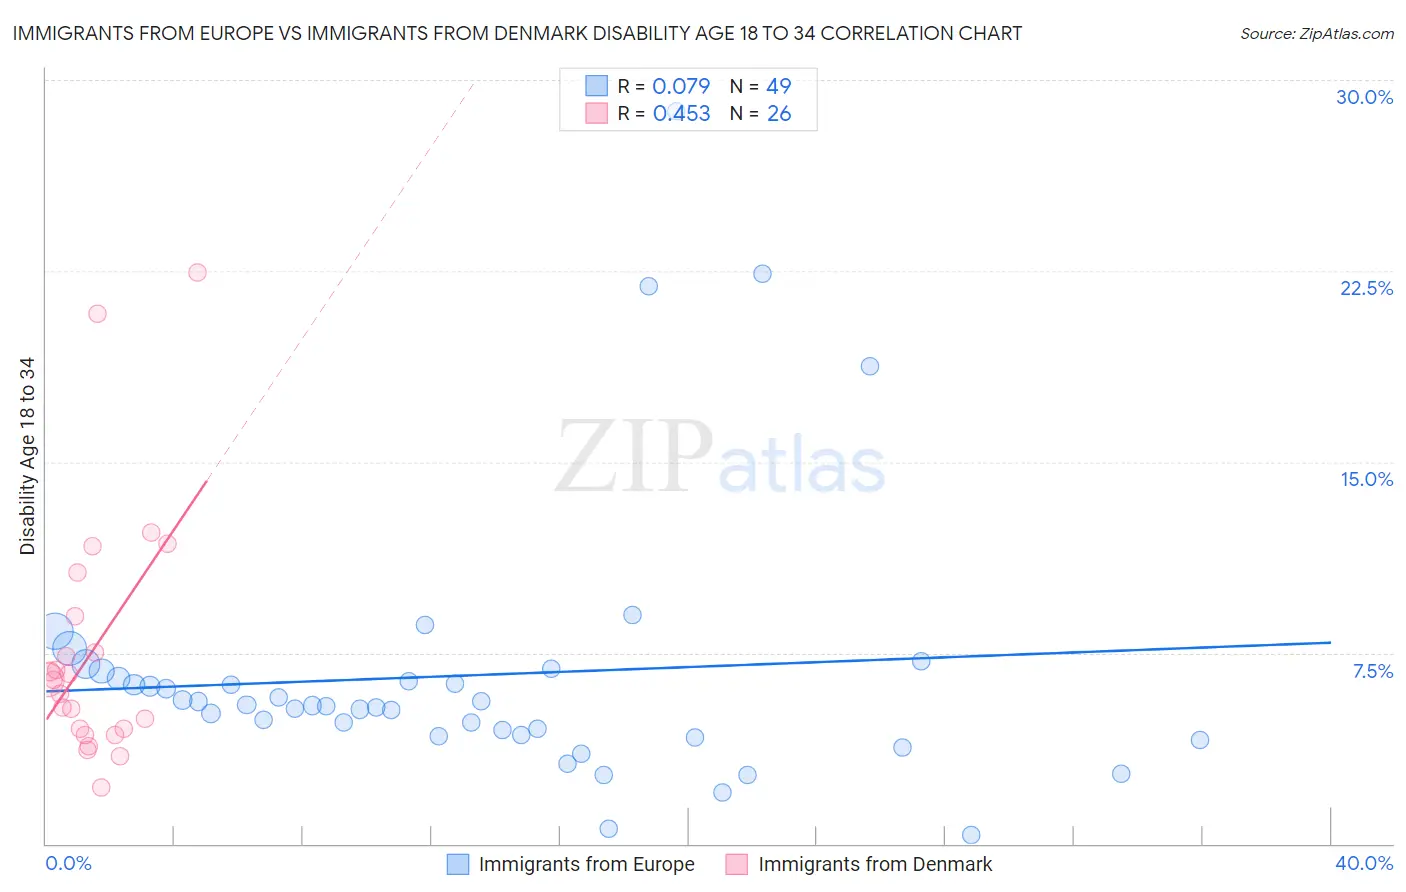
Immigrants from Europe vs Immigrants from Denmark Disability Age 18 to 34 Correlation Chart
The statistical analysis conducted on geographies consisting of 543,483,313 people shows a slight positive correlation between the proportion of Immigrants from Europe and percentage of population with a disability between the ages 18 and 35 in the United States with a correlation coefficient (R) of 0.079 and weighted average of 6.4%. Similarly, the statistical analysis conducted on geographies consisting of 136,291,158 people shows a moderate positive correlation between the proportion of Immigrants from Denmark and percentage of population with a disability between the ages 18 and 35 in the United States with a correlation coefficient (R) of 0.453 and weighted average of 6.5%, a difference of 2.1%.
Disability Age 18 to 34 Correlation Summary
| Measurement | Immigrants from Europe | Immigrants from Denmark |
| Minimum | 0.33% | 2.2% |
| Maximum | 28.8% | 22.4% |
| Range | 28.5% | 20.2% |
| Mean | 6.6% | 7.6% |
| Median | 5.4% | 6.4% |
| Interquartile 25% (IQ1) | 4.2% | 4.5% |
| Interquartile 75% (IQ3) | 6.6% | 8.9% |
| Interquartile Range (IQR) | 2.4% | 4.4% |
| Standard Deviation (Sample) | 5.3% | 4.9% |
| Standard Deviation (Population) | 5.3% | 4.8% |
Similar Demographics by Disability Age 18 to 34
Demographics Similar to Immigrants from Europe by Disability Age 18 to 34
In terms of disability age 18 to 34, the demographic groups most similar to Immigrants from Europe are Brazilian (6.4%, a difference of 0.030%), Palestinian (6.4%, a difference of 0.040%), Immigrants from Sweden (6.4%, a difference of 0.050%), Guatemalan (6.4%, a difference of 0.15%), and Immigrants from Honduras (6.4%, a difference of 0.18%).
| Demographics | Rating | Rank | Disability Age 18 to 34 |
| West Indians | 92.0 /100 | #127 | Exceptional 6.3% |
| Chinese | 91.9 /100 | #128 | Exceptional 6.3% |
| Immigrants | Italy | 90.5 /100 | #129 | Exceptional 6.3% |
| Immigrants | Dominica | 90.5 /100 | #130 | Exceptional 6.3% |
| Immigrants | Saudi Arabia | 90.4 /100 | #131 | Exceptional 6.3% |
| Guatemalans | 89.6 /100 | #132 | Excellent 6.4% |
| Brazilians | 89.0 /100 | #133 | Excellent 6.4% |
| Immigrants | Europe | 88.8 /100 | #134 | Excellent 6.4% |
| Palestinians | 88.5 /100 | #135 | Excellent 6.4% |
| Immigrants | Sweden | 88.5 /100 | #136 | Excellent 6.4% |
| Immigrants | Honduras | 87.7 /100 | #137 | Excellent 6.4% |
| Spanish American Indians | 87.7 /100 | #138 | Excellent 6.4% |
| Immigrants | Belize | 87.4 /100 | #139 | Excellent 6.4% |
| Immigrants | Fiji | 87.3 /100 | #140 | Excellent 6.4% |
| Jamaicans | 86.8 /100 | #141 | Excellent 6.4% |
Demographics Similar to Immigrants from Denmark by Disability Age 18 to 34
In terms of disability age 18 to 34, the demographic groups most similar to Immigrants from Denmark are South African (6.5%, a difference of 0.0%), Arab (6.5%, a difference of 0.060%), Immigrants from Southern Europe (6.5%, a difference of 0.080%), Immigrants from Nigeria (6.5%, a difference of 0.11%), and Dominican (6.5%, a difference of 0.17%).
| Demographics | Rating | Rank | Disability Age 18 to 34 |
| Immigrants | Panama | 75.3 /100 | #156 | Good 6.5% |
| Immigrants | Sierra Leone | 75.0 /100 | #157 | Good 6.5% |
| Zimbabweans | 74.7 /100 | #158 | Good 6.5% |
| Dominicans | 73.6 /100 | #159 | Good 6.5% |
| Immigrants | Southern Europe | 72.5 /100 | #160 | Good 6.5% |
| Arabs | 72.3 /100 | #161 | Good 6.5% |
| South Africans | 71.7 /100 | #162 | Good 6.5% |
| Immigrants | Denmark | 71.7 /100 | #163 | Good 6.5% |
| Immigrants | Nigeria | 70.4 /100 | #164 | Good 6.5% |
| Immigrants | Hungary | 69.6 /100 | #165 | Good 6.5% |
| Eastern Europeans | 65.1 /100 | #166 | Good 6.5% |
| Immigrants | Northern Europe | 64.1 /100 | #167 | Good 6.5% |
| Immigrants | Moldova | 63.1 /100 | #168 | Good 6.5% |
| Russians | 60.2 /100 | #169 | Good 6.5% |
| Immigrants | Bahamas | 57.9 /100 | #170 | Average 6.6% |