Immigrants from Ethiopia vs Immigrants from Netherlands Disability Age 18 to 34
COMPARE
Immigrants from Ethiopia
Immigrants from Netherlands
Disability Age 18 to 34
Disability Age 18 to 34 Comparison
Immigrants from Ethiopia
Immigrants from Netherlands
6.2%
DISABILITY AGE 18 TO 34
96.9/ 100
METRIC RATING
99th/ 347
METRIC RANK
6.7%
DISABILITY AGE 18 TO 34
21.0/ 100
METRIC RATING
196th/ 347
METRIC RANK
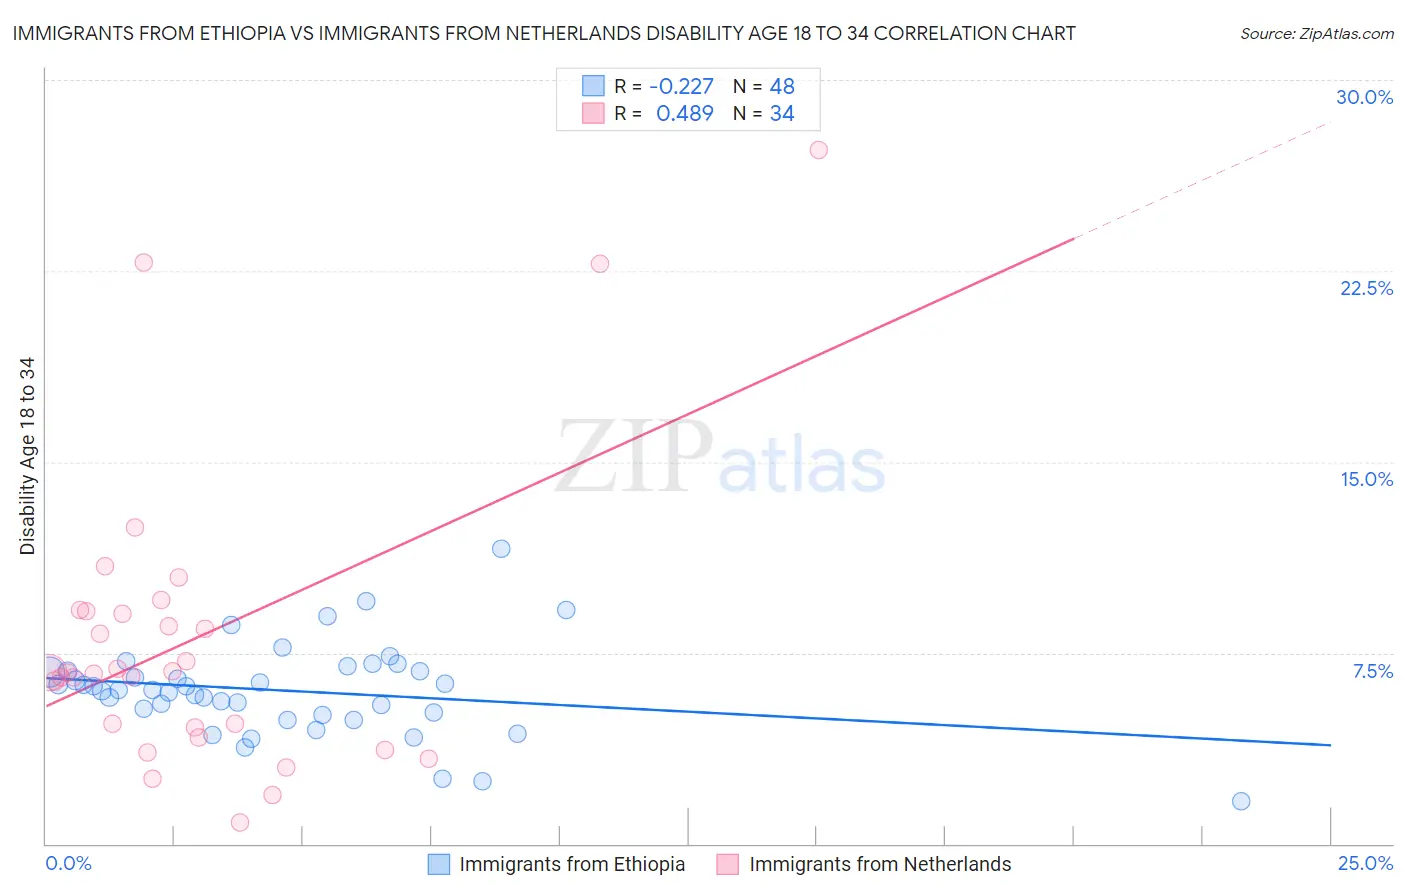
Immigrants from Ethiopia vs Immigrants from Netherlands Disability Age 18 to 34 Correlation Chart
The statistical analysis conducted on geographies consisting of 211,413,965 people shows a weak negative correlation between the proportion of Immigrants from Ethiopia and percentage of population with a disability between the ages 18 and 35 in the United States with a correlation coefficient (R) of -0.227 and weighted average of 6.2%. Similarly, the statistical analysis conducted on geographies consisting of 237,435,105 people shows a moderate positive correlation between the proportion of Immigrants from Netherlands and percentage of population with a disability between the ages 18 and 35 in the United States with a correlation coefficient (R) of 0.489 and weighted average of 6.7%, a difference of 8.8%.
Disability Age 18 to 34 Correlation Summary
| Measurement | Immigrants from Ethiopia | Immigrants from Netherlands |
| Minimum | 1.7% | 0.83% |
| Maximum | 11.6% | 27.3% |
| Range | 9.9% | 26.4% |
| Mean | 6.0% | 8.0% |
| Median | 6.0% | 6.7% |
| Interquartile 25% (IQ1) | 5.1% | 4.6% |
| Interquartile 75% (IQ3) | 6.8% | 9.1% |
| Interquartile Range (IQR) | 1.7% | 4.6% |
| Standard Deviation (Sample) | 1.8% | 5.8% |
| Standard Deviation (Population) | 1.8% | 5.7% |
Similar Demographics by Disability Age 18 to 34
Demographics Similar to Immigrants from Ethiopia by Disability Age 18 to 34
In terms of disability age 18 to 34, the demographic groups most similar to Immigrants from Ethiopia are Immigrants from Albania (6.2%, a difference of 0.12%), Immigrants from Syria (6.2%, a difference of 0.21%), Uruguayan (6.2%, a difference of 0.25%), Immigrants from Jamaica (6.2%, a difference of 0.28%), and Laotian (6.2%, a difference of 0.30%).
| Demographics | Rating | Rank | Disability Age 18 to 34 |
| Jordanians | 97.6 /100 | #92 | Exceptional 6.2% |
| Immigrants | Immigrants | 97.6 /100 | #93 | Exceptional 6.2% |
| Immigrants | Kazakhstan | 97.5 /100 | #94 | Exceptional 6.2% |
| Central Americans | 97.5 /100 | #95 | Exceptional 6.2% |
| Immigrants | Uruguay | 97.4 /100 | #96 | Exceptional 6.2% |
| Uruguayans | 97.3 /100 | #97 | Exceptional 6.2% |
| Immigrants | Syria | 97.2 /100 | #98 | Exceptional 6.2% |
| Immigrants | Ethiopia | 96.9 /100 | #99 | Exceptional 6.2% |
| Immigrants | Albania | 96.7 /100 | #100 | Exceptional 6.2% |
| Immigrants | Jamaica | 96.4 /100 | #101 | Exceptional 6.2% |
| Laotians | 96.4 /100 | #102 | Exceptional 6.2% |
| Immigrants | Bulgaria | 96.3 /100 | #103 | Exceptional 6.2% |
| Mongolians | 96.2 /100 | #104 | Exceptional 6.2% |
| Bhutanese | 96.2 /100 | #105 | Exceptional 6.2% |
| Immigrants | Afghanistan | 95.9 /100 | #106 | Exceptional 6.2% |
Demographics Similar to Immigrants from Netherlands by Disability Age 18 to 34
In terms of disability age 18 to 34, the demographic groups most similar to Immigrants from Netherlands are Estonian (6.8%, a difference of 0.040%), Mexican American Indian (6.7%, a difference of 0.13%), Australian (6.8%, a difference of 0.16%), Kenyan (6.8%, a difference of 0.29%), and Immigrants from Sudan (6.7%, a difference of 0.38%).
| Demographics | Rating | Rank | Disability Age 18 to 34 |
| Pakistanis | 33.7 /100 | #189 | Fair 6.7% |
| Immigrants | Zimbabwe | 33.6 /100 | #190 | Fair 6.7% |
| Immigrants | Eastern Africa | 33.2 /100 | #191 | Fair 6.7% |
| Immigrants | Western Africa | 28.3 /100 | #192 | Fair 6.7% |
| Immigrants | Uganda | 25.1 /100 | #193 | Fair 6.7% |
| Immigrants | Sudan | 24.9 /100 | #194 | Fair 6.7% |
| Mexican American Indians | 22.3 /100 | #195 | Fair 6.7% |
| Immigrants | Netherlands | 21.0 /100 | #196 | Fair 6.7% |
| Estonians | 20.6 /100 | #197 | Fair 6.8% |
| Australians | 19.4 /100 | #198 | Poor 6.8% |
| Kenyans | 18.3 /100 | #199 | Poor 6.8% |
| Sierra Leoneans | 17.5 /100 | #200 | Poor 6.8% |
| Greeks | 16.1 /100 | #201 | Poor 6.8% |
| Panamanians | 15.8 /100 | #202 | Poor 6.8% |
| Hispanics or Latinos | 13.8 /100 | #203 | Poor 6.8% |