Immigrants from Egypt vs Slavic Disability Age 18 to 34
COMPARE
Immigrants from Egypt
Slavic
Disability Age 18 to 34
Disability Age 18 to 34 Comparison
Immigrants from Egypt
Slavs
5.9%
DISABILITY AGE 18 TO 34
99.8/ 100
METRIC RATING
47th/ 347
METRIC RANK
7.4%
DISABILITY AGE 18 TO 34
0.1/ 100
METRIC RATING
273rd/ 347
METRIC RANK
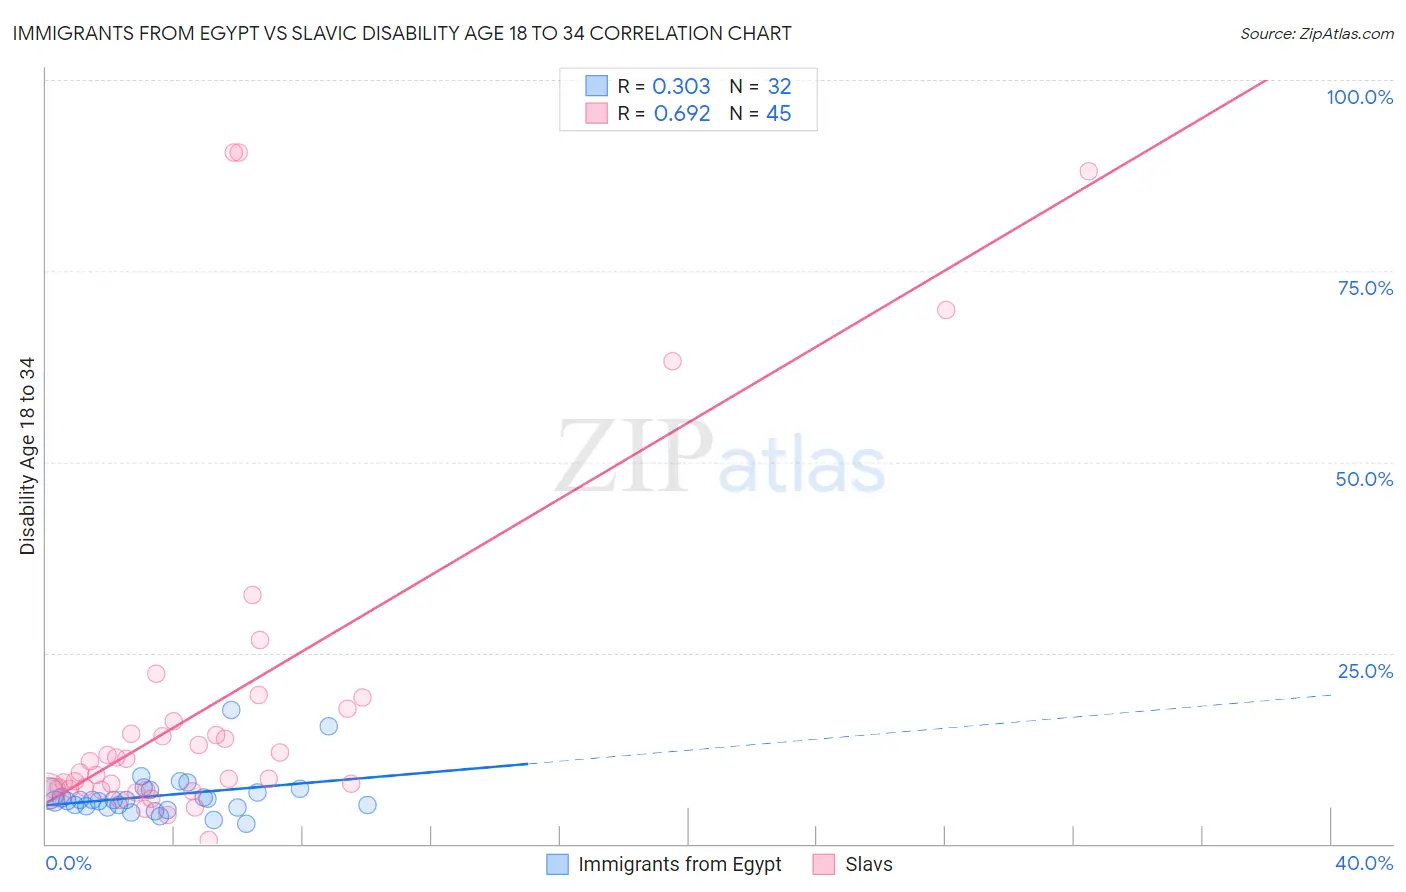
Immigrants from Egypt vs Slavic Disability Age 18 to 34 Correlation Chart
The statistical analysis conducted on geographies consisting of 245,274,625 people shows a mild positive correlation between the proportion of Immigrants from Egypt and percentage of population with a disability between the ages 18 and 35 in the United States with a correlation coefficient (R) of 0.303 and weighted average of 5.9%. Similarly, the statistical analysis conducted on geographies consisting of 270,473,270 people shows a significant positive correlation between the proportion of Slavs and percentage of population with a disability between the ages 18 and 35 in the United States with a correlation coefficient (R) of 0.692 and weighted average of 7.4%, a difference of 25.8%.
Disability Age 18 to 34 Correlation Summary
| Measurement | Immigrants from Egypt | Slavic |
| Minimum | 2.6% | 0.47% |
| Maximum | 17.6% | 90.5% |
| Range | 15.0% | 90.0% |
| Mean | 6.3% | 18.6% |
| Median | 5.7% | 9.3% |
| Interquartile 25% (IQ1) | 4.8% | 7.2% |
| Interquartile 75% (IQ3) | 6.9% | 16.9% |
| Interquartile Range (IQR) | 2.0% | 9.7% |
| Standard Deviation (Sample) | 3.0% | 23.2% |
| Standard Deviation (Population) | 3.0% | 23.0% |
Similar Demographics by Disability Age 18 to 34
Demographics Similar to Immigrants from Egypt by Disability Age 18 to 34
In terms of disability age 18 to 34, the demographic groups most similar to Immigrants from Egypt are Immigrants from Korea (5.9%, a difference of 0.050%), Immigrants from Peru (5.9%, a difference of 0.18%), Immigrants from Asia (5.9%, a difference of 0.31%), South American (5.9%, a difference of 0.33%), and Colombian (5.9%, a difference of 0.34%).
| Demographics | Rating | Rank | Disability Age 18 to 34 |
| Bolivians | 99.9 /100 | #40 | Exceptional 5.8% |
| Nicaraguans | 99.9 /100 | #41 | Exceptional 5.8% |
| Colombians | 99.8 /100 | #42 | Exceptional 5.9% |
| South Americans | 99.8 /100 | #43 | Exceptional 5.9% |
| Immigrants | Asia | 99.8 /100 | #44 | Exceptional 5.9% |
| Immigrants | Peru | 99.8 /100 | #45 | Exceptional 5.9% |
| Immigrants | Korea | 99.8 /100 | #46 | Exceptional 5.9% |
| Immigrants | Egypt | 99.8 /100 | #47 | Exceptional 5.9% |
| Immigrants | Trinidad and Tobago | 99.8 /100 | #48 | Exceptional 5.9% |
| Immigrants | Belarus | 99.8 /100 | #49 | Exceptional 5.9% |
| Immigrants | El Salvador | 99.8 /100 | #50 | Exceptional 5.9% |
| Egyptians | 99.8 /100 | #51 | Exceptional 5.9% |
| Okinawans | 99.7 /100 | #52 | Exceptional 5.9% |
| Immigrants | Indonesia | 99.7 /100 | #53 | Exceptional 5.9% |
| Immigrants | Malaysia | 99.7 /100 | #54 | Exceptional 5.9% |
Demographics Similar to Slavs by Disability Age 18 to 34
In terms of disability age 18 to 34, the demographic groups most similar to Slavs are African (7.4%, a difference of 0.010%), Tsimshian (7.4%, a difference of 0.050%), Immigrants from Somalia (7.4%, a difference of 0.080%), European (7.4%, a difference of 0.13%), and Swiss (7.4%, a difference of 0.14%).
| Demographics | Rating | Rank | Disability Age 18 to 34 |
| German Russians | 0.1 /100 | #266 | Tragic 7.4% |
| Bangladeshis | 0.1 /100 | #267 | Tragic 7.4% |
| Portuguese | 0.1 /100 | #268 | Tragic 7.4% |
| Basques | 0.1 /100 | #269 | Tragic 7.4% |
| Belgians | 0.1 /100 | #270 | Tragic 7.4% |
| Swiss | 0.1 /100 | #271 | Tragic 7.4% |
| Tsimshian | 0.1 /100 | #272 | Tragic 7.4% |
| Slavs | 0.1 /100 | #273 | Tragic 7.4% |
| Africans | 0.1 /100 | #274 | Tragic 7.4% |
| Immigrants | Somalia | 0.1 /100 | #275 | Tragic 7.4% |
| Europeans | 0.1 /100 | #276 | Tragic 7.4% |
| Immigrants | Portugal | 0.1 /100 | #277 | Tragic 7.4% |
| Lumbee | 0.1 /100 | #278 | Tragic 7.4% |
| Czechoslovakians | 0.1 /100 | #279 | Tragic 7.4% |
| Yaqui | 0.1 /100 | #280 | Tragic 7.4% |