Immigrants from Eastern Asia vs Immigrants from Greece Disability Age 65 to 74

COMPARE

Immigrants from Eastern Asia
Race
Ancestry
AfghanAfricanAlaska NativeAlaskan AthabascanAlbanianAleutAlsatianAmericanApacheArabArapahoArgentineanArmenianAssyrian/Chaldean/SyriacAustralianAustrianBahamianBangladeshiBarbadianBasqueBelgianBelizeanBermudanBhutaneseBlackfeetBolivianBrazilianBritishBritish West IndianBulgarianBurmeseCajunCambodianCanadianCape VerdeanCarpatho RusynCelticCentral AmericanCentral American IndianCherokeeCheyenneChickasawChileanChineseChippewaChoctawColombianColvilleComancheCosta RicanCreeCreekCroatianCrowCubanCypriotCzechCzechoslovakianDanishDelawareDominicanDutchDutch West IndianEastern EuropeanEcuadorianEgyptianEnglishEstonianEthiopianEuropeanFijianFilipinoFinnishFrenchFrench American IndianFrench CanadianGermanGerman RussianGhanaianGreekGuamanian/ChamorroGuatemalanGuyaneseHaitianHmongHonduranHopiHoumaHungarianIcelanderIndian (Asian)IndonesianInupiatIranianIraqiIrishIroquoisIsraeliItalianJamaicanJapaneseJordanianKenyanKiowaKoreanLaotianLatvianLebaneseLiberianLithuanianLumbeeLuxembourgerMacedonianMalaysianMalteseMarshalleseMenomineeMexicanMexican American IndianMongolianMoroccanNative HawaiianNavajoNepaleseNew ZealanderNicaraguanNigerianNorthern EuropeanNorwegianOkinawanOsageOttawaPaiutePakistaniPalestinianPanamanianParaguayanPennsylvania GermanPeruvianPimaPolishPortuguesePotawatomiPuebloPuerto RicanPuget Sound SalishRomanianRussianSalvadoranSamoanScandinavianScotch-IrishScottishSeminoleSenegaleseSerbianShoshoneSierra LeoneanSiouxSlavicSlovakSloveneSomaliSouth AfricanSouth AmericanSouth American IndianSoviet UnionSpaniardSpanishSpanish AmericanSpanish American IndianSri LankanSubsaharan AfricanSudaneseSwedishSwissSyrianTaiwaneseThaiTlingit-HaidaTohono O'OdhamTonganTrinidadian and TobagonianTsimshianTurkishU.S. Virgin IslanderUgandanUkrainianUruguayanUteVenezuelanVietnameseWelshWest IndianYakamaYaquiYugoslavianYumanYup'ikZimbabwean
Immigration
NonimmigrantsImmigrantsAfghanistanAfricaAlbaniaArgentinaArmeniaAsiaAustraliaAustriaBahamasBangladeshBarbadosBelarusBelgiumBelizeBoliviaBosnia and HerzegovinaBrazilBulgariaBurma/MyanmarCabo VerdeCambodiaCameroonCanadaCaribbeanCentral AmericaChileChinaColombiaCongoCosta RicaCroatiaCubaCzechoslovakiaDenmarkDominicaDominican RepublicEastern AfricaEastern AsiaEastern EuropeEcuadorEgyptEl SalvadorEnglandEritreaEthiopiaEuropeFijiFranceGermanyGhanaGrenadaGuatemalaGuyanaHaitiHondurasHong KongHungaryIndiaIndonesiaIranIraqIrelandIsraelItalyJamaicaJapanJordanKazakhstanKenyaKoreaKuwaitLaosLatin AmericaLatviaLebanonLiberiaLithuaniaMalaysiaMexicoMicronesiaMiddle AfricaMoldovaMoroccoNepalNetherlandsNicaraguaNigeriaNorth AmericaNorth MacedoniaNorthern AfricaNorthern EuropeNorwayOceaniaPakistanPanamaPeruPhilippinesPolandPortugalRomaniaRussiaSaudi ArabiaScotlandSenegalSerbiaSierra LeoneSingaporeSomaliaSouth AfricaSouth AmericaSouth Central AsiaSouth Eastern AsiaSouthern EuropeSpainSri LankaSt. Vincent and the GrenadinesSudanSwedenSwitzerlandSyriaTaiwanThailandTrinidad and TobagoTurkeyUgandaUkraineUruguayUzbekistanVenezuelaVietnamWest IndiesWestern AfricaWestern AsiaWestern EuropeYemenZaireZimbabweAzores
Immigrants from Greece
Race
Ancestry
AfghanAfricanAlaska NativeAlaskan AthabascanAlbanianAleutAlsatianAmericanApacheArabArapahoArgentineanArmenianAssyrian/Chaldean/SyriacAustralianAustrianBahamianBangladeshiBarbadianBasqueBelgianBelizeanBermudanBhutaneseBlackfeetBolivianBrazilianBritishBritish West IndianBulgarianBurmeseCajunCambodianCanadianCape VerdeanCarpatho RusynCelticCentral AmericanCentral American IndianCherokeeCheyenneChickasawChileanChineseChippewaChoctawColombianColvilleComancheCosta RicanCreeCreekCroatianCrowCubanCypriotCzechCzechoslovakianDanishDelawareDominicanDutchDutch West IndianEastern EuropeanEcuadorianEgyptianEnglishEstonianEthiopianEuropeanFijianFilipinoFinnishFrenchFrench American IndianFrench CanadianGermanGerman RussianGhanaianGreekGuamanian/ChamorroGuatemalanGuyaneseHaitianHmongHonduranHopiHoumaHungarianIcelanderIndian (Asian)IndonesianInupiatIranianIraqiIrishIroquoisIsraeliItalianJamaicanJapaneseJordanianKenyanKiowaKoreanLaotianLatvianLebaneseLiberianLithuanianLumbeeLuxembourgerMacedonianMalaysianMalteseMarshalleseMenomineeMexicanMexican American IndianMongolianMoroccanNative HawaiianNavajoNepaleseNew ZealanderNicaraguanNigerianNorthern EuropeanNorwegianOkinawanOsageOttawaPaiutePakistaniPalestinianPanamanianParaguayanPennsylvania GermanPeruvianPimaPolishPortuguesePotawatomiPuebloPuerto RicanPuget Sound SalishRomanianRussianSalvadoranSamoanScandinavianScotch-IrishScottishSeminoleSenegaleseSerbianShoshoneSierra LeoneanSiouxSlavicSlovakSloveneSomaliSouth AfricanSouth AmericanSouth American IndianSoviet UnionSpaniardSpanishSpanish AmericanSpanish American IndianSri LankanSubsaharan AfricanSudaneseSwedishSwissSyrianTaiwaneseThaiTlingit-HaidaTohono O'OdhamTonganTrinidadian and TobagonianTsimshianTurkishU.S. Virgin IslanderUgandanUkrainianUruguayanUteVenezuelanVietnameseWelshWest IndianYakamaYaquiYugoslavianYumanYup'ikZimbabwean
Immigration
NonimmigrantsImmigrantsAfghanistanAfricaAlbaniaArgentinaArmeniaAsiaAustraliaAustriaBahamasBangladeshBarbadosBelarusBelgiumBelizeBoliviaBosnia and HerzegovinaBrazilBulgariaBurma/MyanmarCabo VerdeCambodiaCameroonCanadaCaribbeanCentral AmericaChileChinaColombiaCongoCosta RicaCroatiaCubaCzechoslovakiaDenmarkDominicaDominican RepublicEastern AfricaEastern EuropeEcuadorEgyptEl SalvadorEnglandEritreaEthiopiaEuropeFijiFranceGermanyGhanaGreeceGrenadaGuatemalaGuyanaHaitiHondurasHong KongHungaryIndiaIndonesiaIranIraqIrelandIsraelItalyJamaicaJapanJordanKazakhstanKenyaKoreaKuwaitLaosLatin AmericaLatviaLebanonLiberiaLithuaniaMalaysiaMexicoMicronesiaMiddle AfricaMoldovaMoroccoNepalNetherlandsNicaraguaNigeriaNorth AmericaNorth MacedoniaNorthern AfricaNorthern EuropeNorwayOceaniaPakistanPanamaPeruPhilippinesPolandPortugalRomaniaRussiaSaudi ArabiaScotlandSenegalSerbiaSierra LeoneSingaporeSomaliaSouth AfricaSouth AmericaSouth Central AsiaSouth Eastern AsiaSouthern EuropeSpainSri LankaSt. Vincent and the GrenadinesSudanSwedenSwitzerlandSyriaTaiwanThailandTrinidad and TobagoTurkeyUgandaUkraineUruguayUzbekistanVenezuelaVietnamWest IndiesWestern AfricaWestern AsiaWestern EuropeYemenZaireZimbabweAzores
Disability Age 65 to 74
Income
Poverty
Unemployment
Labor Participation
Family Structure
Vehicle Availability
Education Level
Disability

Disability Age 65 to 74 Comparison

Immigrants from Eastern Asia

Immigrants from Greece

Exceptional
Exceptional
20.3%
DISABILITY AGE 65 TO 74
100.0/ 100
METRIC RATING
10th/ 347
METRIC RANK
21.0%
DISABILITY AGE 65 TO 74
99.9/ 100
METRIC RATING
30th/ 347
METRIC RANK

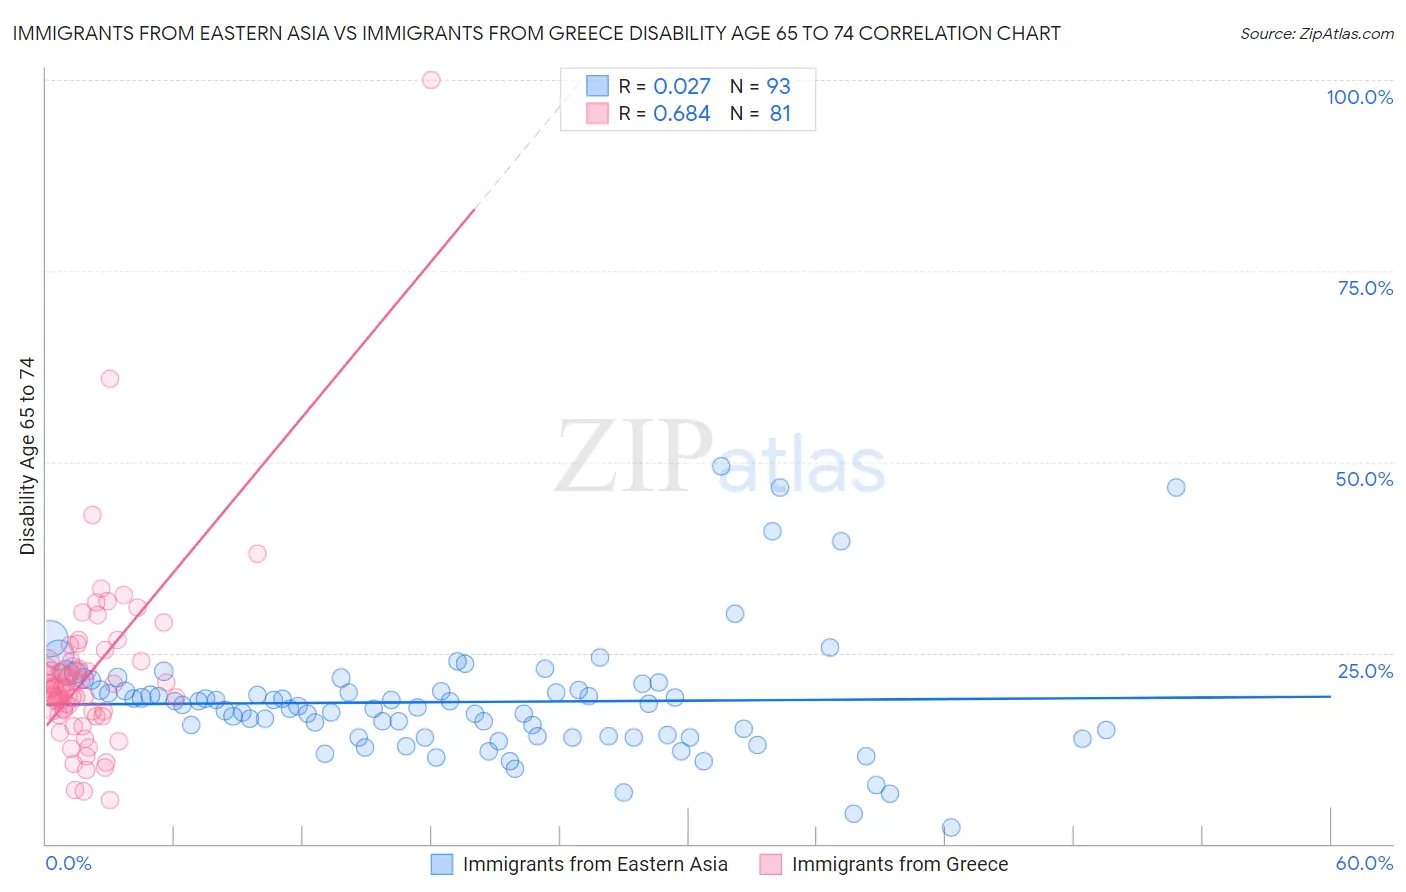
Immigrants from Eastern Asia vs Immigrants from Greece Disability Age 65 to 74 Correlation Chart

The statistical analysis conducted on geographies consisting of 498,306,983 people shows no correlation between the proportion of Immigrants from Eastern Asia and percentage of population with a disability between the ages 65 and 75 in the United States with a correlation coefficient (R) of 0.027 and weighted average of 20.3%. Similarly, the statistical analysis conducted on geographies consisting of 216,768,071 people shows a significant positive correlation between the proportion of Immigrants from Greece and percentage of population with a disability between the ages 65 and 75 in the United States with a correlation coefficient (R) of 0.684 and weighted average of 21.0%, a difference of 3.6%.
Immigrants from Eastern Asia vs Immigrants from Greece Disability Age 65 to 74

Disability Age 65 to 74 Correlation Summary

MeasurementImmigrants from Eastern AsiaImmigrants from Greece
Minimum2.2%5.8%
Maximum49.4%100.0%
Range47.2%94.2%
Mean18.6%22.0%
Median18.0%20.5%
Interquartile 25% (IQ1)14.0%17.4%
Interquartile 75% (IQ3)20.2%23.4%
Interquartile Range (IQR)6.1%6.0%
Standard Deviation (Sample)7.9%11.9%
Standard Deviation (Population)7.8%11.8%

Demographics Similar to Immigrants from Eastern Asia and Immigrants from Greece by Disability Age 65 to 74

In terms of disability age 65 to 74, the demographic groups most similar to Immigrants from Eastern Asia are Immigrants from Ireland (20.3%, a difference of 0.16%), Immigrants from Korea (20.4%, a difference of 0.37%), Immigrants from Singapore (20.4%, a difference of 0.76%), Indian (Asian) (20.5%, a difference of 1.2%), and Paraguayan (20.5%, a difference of 1.3%). Similarly, the demographic groups most similar to Immigrants from Greece are Immigrants from Japan (21.0%, a difference of 0.040%), Immigrants from Czechoslovakia (21.0%, a difference of 0.080%), Immigrants from Sweden (21.0%, a difference of 0.18%), Immigrants from Australia (21.0%, a difference of 0.20%), and Bolivian (21.0%, a difference of 0.21%).
DemographicsRating | RankDisability Age 65 to 74
Immigrants | Eastern Asia
100.0
/100
|
#10
Exceptional
20.3%
Immigrants | Ireland
100.0
/100
|
#11
Exceptional
20.3%
Immigrants | Korea
100.0
/100
|
#12
Exceptional
20.4%
Immigrants | Singapore
100.0
/100
|
#13
Exceptional
20.4%
Indians (Asian)
100.0
/100
|
#14
Exceptional
20.5%
Paraguayans
100.0
/100
|
#15
Exceptional
20.5%
Immigrants | Lithuania
100.0
/100
|
#16
Exceptional
20.5%
Immigrants | South Central Asia
100.0
/100
|
#17
Exceptional
20.6%
Eastern Europeans
100.0
/100
|
#18
Exceptional
20.6%
Burmese
100.0
/100
|
#19
Exceptional
20.6%
Okinawans
100.0
/100
|
#20
Exceptional
20.7%
Immigrants | Bolivia
99.9
/100
|
#21
Exceptional
20.8%
Immigrants | Iran
99.9
/100
|
#22
Exceptional
20.9%
Immigrants | Belgium
99.9
/100
|
#23
Exceptional
21.0%
Soviet Union
99.9
/100
|
#24
Exceptional
21.0%
Bolivians
99.9
/100
|
#25
Exceptional
21.0%
Immigrants | Australia
99.9
/100
|
#26
Exceptional
21.0%
Immigrants | Sweden
99.9
/100
|
#27
Exceptional
21.0%
Immigrants | Czechoslovakia
99.9
/100
|
#28
Exceptional
21.0%
Immigrants | Japan
99.9
/100
|
#29
Exceptional
21.0%
Immigrants | Greece
99.9
/100
|
#30
Exceptional
21.0%