Immigrants from Cuba vs Albanian Disability Age Under 5
COMPARE
Immigrants from Cuba
Albanian
Disability Age Under 5
Disability Age Under 5 Comparison
Immigrants from Cuba
Albanians
1.1%
DISABILITY AGE UNDER 5
97.0/ 100
METRIC RATING
92nd/ 347
METRIC RANK
1.1%
DISABILITY AGE UNDER 5
97.2/ 100
METRIC RATING
91st/ 347
METRIC RANK
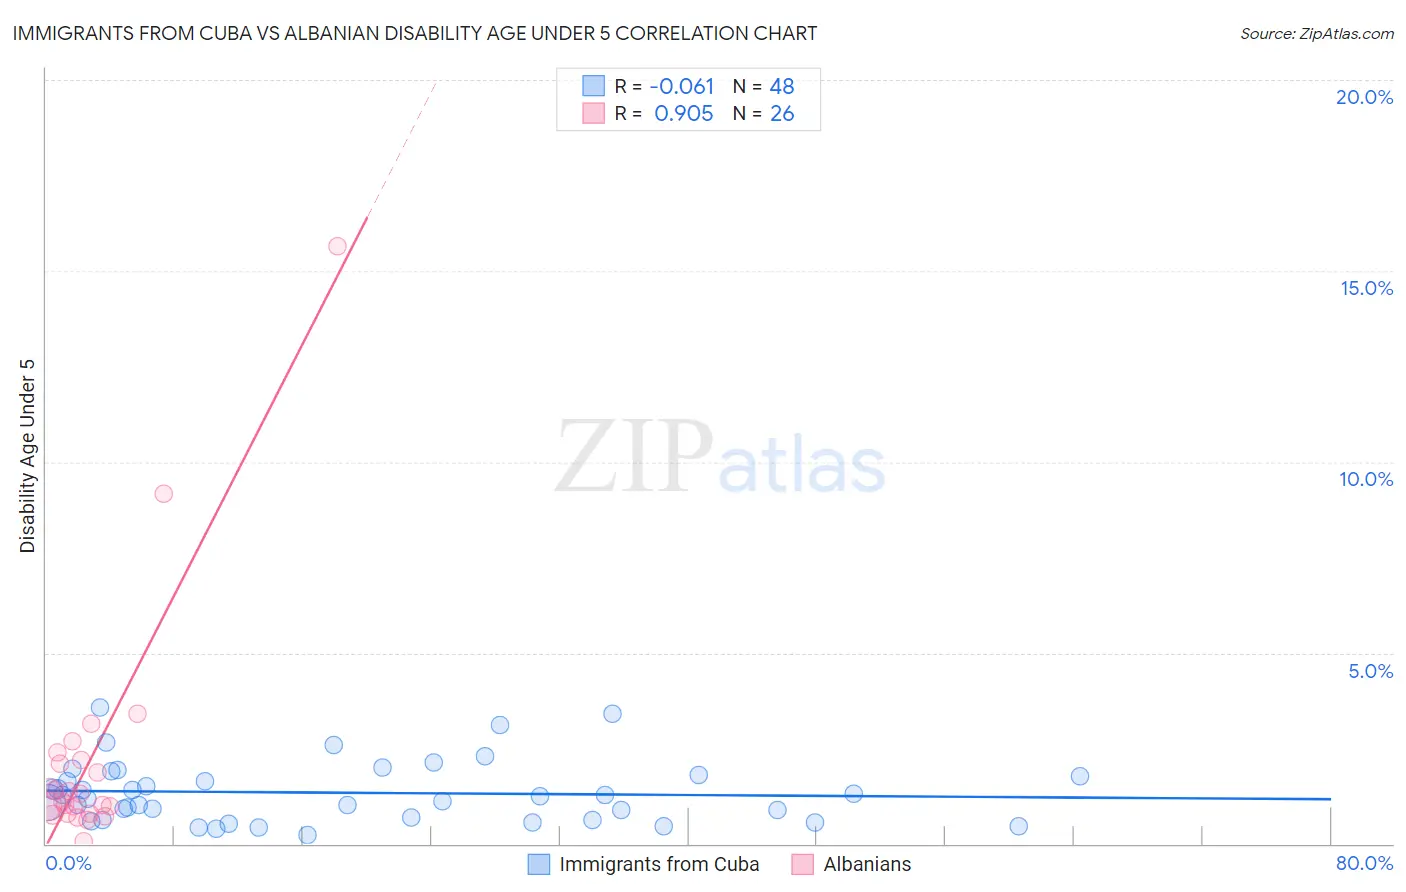
Immigrants from Cuba vs Albanian Disability Age Under 5 Correlation Chart
The statistical analysis conducted on geographies consisting of 186,893,063 people shows a slight negative correlation between the proportion of Immigrants from Cuba and percentage of population with a disability under the age of 5 in the United States with a correlation coefficient (R) of -0.061 and weighted average of 1.1%. Similarly, the statistical analysis conducted on geographies consisting of 123,207,813 people shows a near-perfect positive correlation between the proportion of Albanians and percentage of population with a disability under the age of 5 in the United States with a correlation coefficient (R) of 0.905 and weighted average of 1.1%, a difference of 0.17%.
Disability Age Under 5 Correlation Summary
| Measurement | Immigrants from Cuba | Albanian |
| Minimum | 0.24% | 0.063% |
| Maximum | 3.6% | 15.7% |
| Range | 3.3% | 15.6% |
| Mean | 1.3% | 2.3% |
| Median | 1.2% | 1.2% |
| Interquartile 25% (IQ1) | 0.66% | 0.78% |
| Interquartile 75% (IQ3) | 1.8% | 2.2% |
| Interquartile Range (IQR) | 1.1% | 1.4% |
| Standard Deviation (Sample) | 0.80% | 3.2% |
| Standard Deviation (Population) | 0.79% | 3.2% |
Demographics Similar to Immigrants from Cuba and Albanians by Disability Age Under 5
In terms of disability age under 5, the demographic groups most similar to Immigrants from Cuba are Spanish American (1.1%, a difference of 0.030%), Sri Lankan (1.1%, a difference of 0.090%), Immigrants from Moldova (1.1%, a difference of 0.14%), Chinese (1.1%, a difference of 0.21%), and Ethiopian (1.1%, a difference of 0.24%). Similarly, the demographic groups most similar to Albanians are Chinese (1.1%, a difference of 0.040%), Ethiopian (1.1%, a difference of 0.070%), Spanish American (1.1%, a difference of 0.20%), Sri Lankan (1.1%, a difference of 0.26%), and Immigrants from Moldova (1.1%, a difference of 0.31%).
| Demographics | Rating | Rank | Disability Age Under 5 |
| Turks | 98.0 /100 | #81 | Exceptional 1.1% |
| Immigrants | Jordan | 97.9 /100 | #82 | Exceptional 1.1% |
| Immigrants | Syria | 97.9 /100 | #83 | Exceptional 1.1% |
| Immigrants | Zaire | 97.8 /100 | #84 | Exceptional 1.1% |
| Sudanese | 97.7 /100 | #85 | Exceptional 1.1% |
| Okinawans | 97.6 /100 | #86 | Exceptional 1.1% |
| Ugandans | 97.5 /100 | #87 | Exceptional 1.1% |
| Immigrants | Dominican Republic | 97.5 /100 | #88 | Exceptional 1.1% |
| Ethiopians | 97.2 /100 | #89 | Exceptional 1.1% |
| Chinese | 97.2 /100 | #90 | Exceptional 1.1% |
| Albanians | 97.2 /100 | #91 | Exceptional 1.1% |
| Immigrants | Cuba | 97.0 /100 | #92 | Exceptional 1.1% |
| Spanish Americans | 96.9 /100 | #93 | Exceptional 1.1% |
| Sri Lankans | 96.8 /100 | #94 | Exceptional 1.1% |
| Immigrants | Moldova | 96.8 /100 | #95 | Exceptional 1.1% |
| Mongolians | 96.6 /100 | #96 | Exceptional 1.1% |
| Immigrants | Iraq | 96.5 /100 | #97 | Exceptional 1.1% |
| Immigrants | South Eastern Asia | 96.5 /100 | #98 | Exceptional 1.1% |
| Dominicans | 96.3 /100 | #99 | Exceptional 1.1% |
| Nicaraguans | 96.3 /100 | #100 | Exceptional 1.1% |
| Immigrants | Uganda | 96.1 /100 | #101 | Exceptional 1.1% |