Immigrants from Croatia vs Immigrants from Iran Disability Age 65 to 74
COMPARE
Immigrants from Croatia
Immigrants from Iran
Disability Age 65 to 74
Disability Age 65 to 74 Comparison
Immigrants from Croatia
Immigrants from Iran
21.3%
DISABILITY AGE 65 TO 74
99.7/ 100
METRIC RATING
43rd/ 347
METRIC RANK
20.9%
DISABILITY AGE 65 TO 74
99.9/ 100
METRIC RATING
22nd/ 347
METRIC RANK
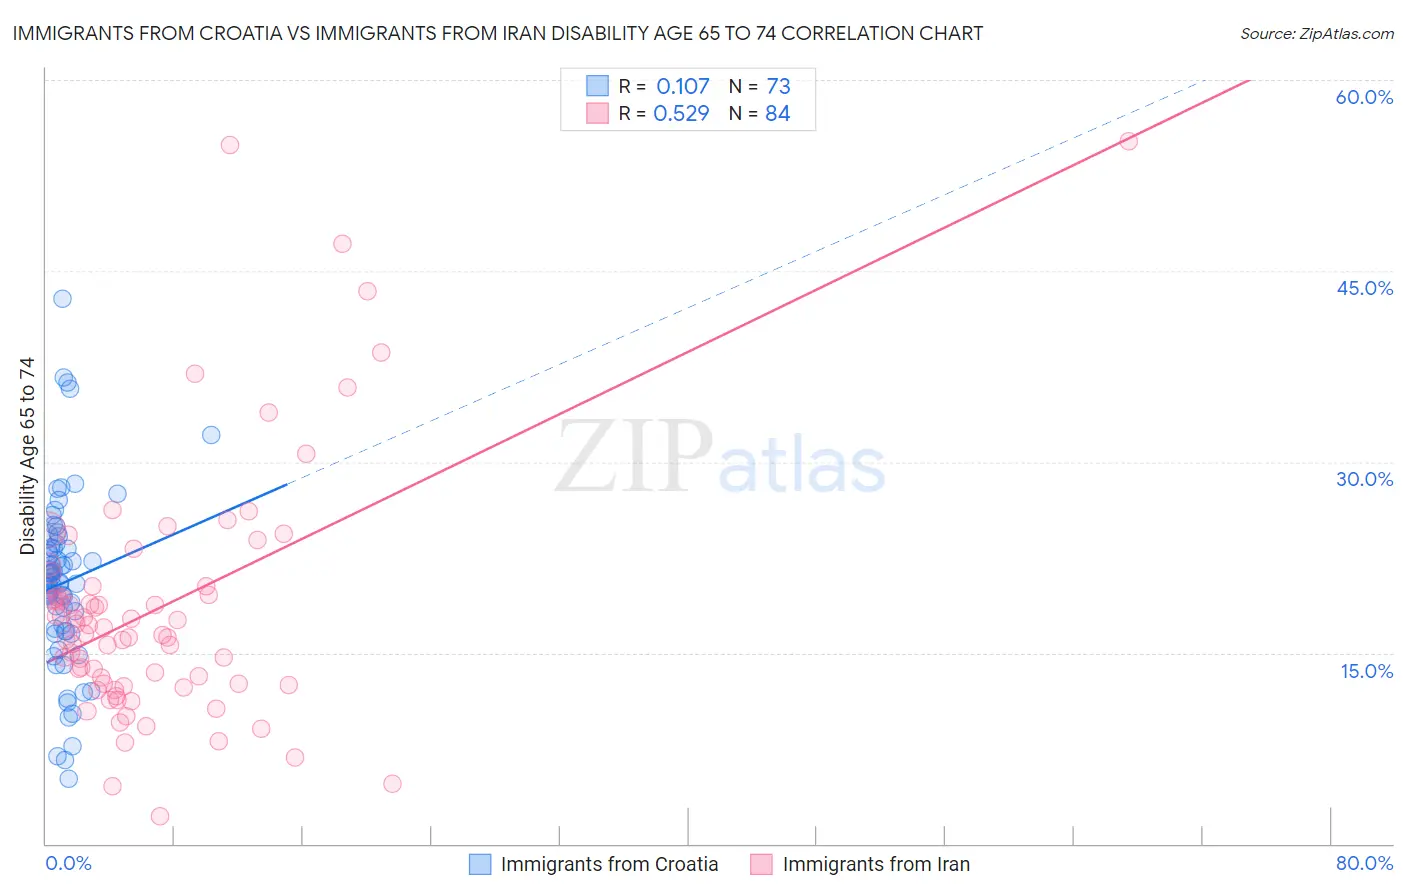
Immigrants from Croatia vs Immigrants from Iran Disability Age 65 to 74 Correlation Chart
The statistical analysis conducted on geographies consisting of 132,519,898 people shows a poor positive correlation between the proportion of Immigrants from Croatia and percentage of population with a disability between the ages 65 and 75 in the United States with a correlation coefficient (R) of 0.107 and weighted average of 21.3%. Similarly, the statistical analysis conducted on geographies consisting of 279,660,502 people shows a substantial positive correlation between the proportion of Immigrants from Iran and percentage of population with a disability between the ages 65 and 75 in the United States with a correlation coefficient (R) of 0.529 and weighted average of 20.9%, a difference of 2.2%.
Disability Age 65 to 74 Correlation Summary
| Measurement | Immigrants from Croatia | Immigrants from Iran |
| Minimum | 5.1% | 2.1% |
| Maximum | 42.9% | 55.2% |
| Range | 37.7% | 53.1% |
| Mean | 20.5% | 18.6% |
| Median | 20.5% | 16.7% |
| Interquartile 25% (IQ1) | 16.7% | 12.5% |
| Interquartile 75% (IQ3) | 23.5% | 20.2% |
| Interquartile Range (IQR) | 6.8% | 7.7% |
| Standard Deviation (Sample) | 6.9% | 9.9% |
| Standard Deviation (Population) | 6.9% | 9.8% |
Similar Demographics by Disability Age 65 to 74
Demographics Similar to Immigrants from Croatia by Disability Age 65 to 74
In terms of disability age 65 to 74, the demographic groups most similar to Immigrants from Croatia are Macedonian (21.3%, a difference of 0.020%), Estonian (21.4%, a difference of 0.13%), Asian (21.4%, a difference of 0.15%), Immigrants from Turkey (21.4%, a difference of 0.18%), and Immigrants from Bulgaria (21.4%, a difference of 0.18%).
| Demographics | Rating | Rank | Disability Age 65 to 74 |
| Immigrants | Switzerland | 99.8 /100 | #36 | Exceptional 21.1% |
| Israelis | 99.8 /100 | #37 | Exceptional 21.2% |
| Russians | 99.8 /100 | #38 | Exceptional 21.2% |
| Argentineans | 99.8 /100 | #39 | Exceptional 21.2% |
| Latvians | 99.8 /100 | #40 | Exceptional 21.2% |
| Immigrants | Austria | 99.8 /100 | #41 | Exceptional 21.2% |
| Macedonians | 99.7 /100 | #42 | Exceptional 21.3% |
| Immigrants | Croatia | 99.7 /100 | #43 | Exceptional 21.3% |
| Estonians | 99.7 /100 | #44 | Exceptional 21.4% |
| Asians | 99.7 /100 | #45 | Exceptional 21.4% |
| Immigrants | Turkey | 99.7 /100 | #46 | Exceptional 21.4% |
| Immigrants | Bulgaria | 99.7 /100 | #47 | Exceptional 21.4% |
| Lithuanians | 99.7 /100 | #48 | Exceptional 21.4% |
| Luxembourgers | 99.7 /100 | #49 | Exceptional 21.4% |
| Immigrants | Malaysia | 99.7 /100 | #50 | Exceptional 21.4% |
Demographics Similar to Immigrants from Iran by Disability Age 65 to 74
In terms of disability age 65 to 74, the demographic groups most similar to Immigrants from Iran are Immigrants from Bolivia (20.8%, a difference of 0.23%), Immigrants from Belgium (21.0%, a difference of 0.31%), Soviet Union (21.0%, a difference of 0.35%), Bolivian (21.0%, a difference of 0.40%), and Immigrants from Australia (21.0%, a difference of 0.42%).
| Demographics | Rating | Rank | Disability Age 65 to 74 |
| Paraguayans | 100.0 /100 | #15 | Exceptional 20.5% |
| Immigrants | Lithuania | 100.0 /100 | #16 | Exceptional 20.5% |
| Immigrants | South Central Asia | 100.0 /100 | #17 | Exceptional 20.6% |
| Eastern Europeans | 100.0 /100 | #18 | Exceptional 20.6% |
| Burmese | 100.0 /100 | #19 | Exceptional 20.6% |
| Okinawans | 100.0 /100 | #20 | Exceptional 20.7% |
| Immigrants | Bolivia | 99.9 /100 | #21 | Exceptional 20.8% |
| Immigrants | Iran | 99.9 /100 | #22 | Exceptional 20.9% |
| Immigrants | Belgium | 99.9 /100 | #23 | Exceptional 21.0% |
| Soviet Union | 99.9 /100 | #24 | Exceptional 21.0% |
| Bolivians | 99.9 /100 | #25 | Exceptional 21.0% |
| Immigrants | Australia | 99.9 /100 | #26 | Exceptional 21.0% |
| Immigrants | Sweden | 99.9 /100 | #27 | Exceptional 21.0% |
| Immigrants | Czechoslovakia | 99.9 /100 | #28 | Exceptional 21.0% |
| Immigrants | Japan | 99.9 /100 | #29 | Exceptional 21.0% |