Immigrants from Costa Rica vs Immigrants from France Disability Age 18 to 34
COMPARE
Immigrants from Costa Rica
Immigrants from France
Disability Age 18 to 34
Disability Age 18 to 34 Comparison
Immigrants from Costa Rica
Immigrants from France
6.3%
DISABILITY AGE 18 TO 34
94.0/ 100
METRIC RATING
116th/ 347
METRIC RANK
6.3%
DISABILITY AGE 18 TO 34
95.1/ 100
METRIC RATING
111th/ 347
METRIC RANK
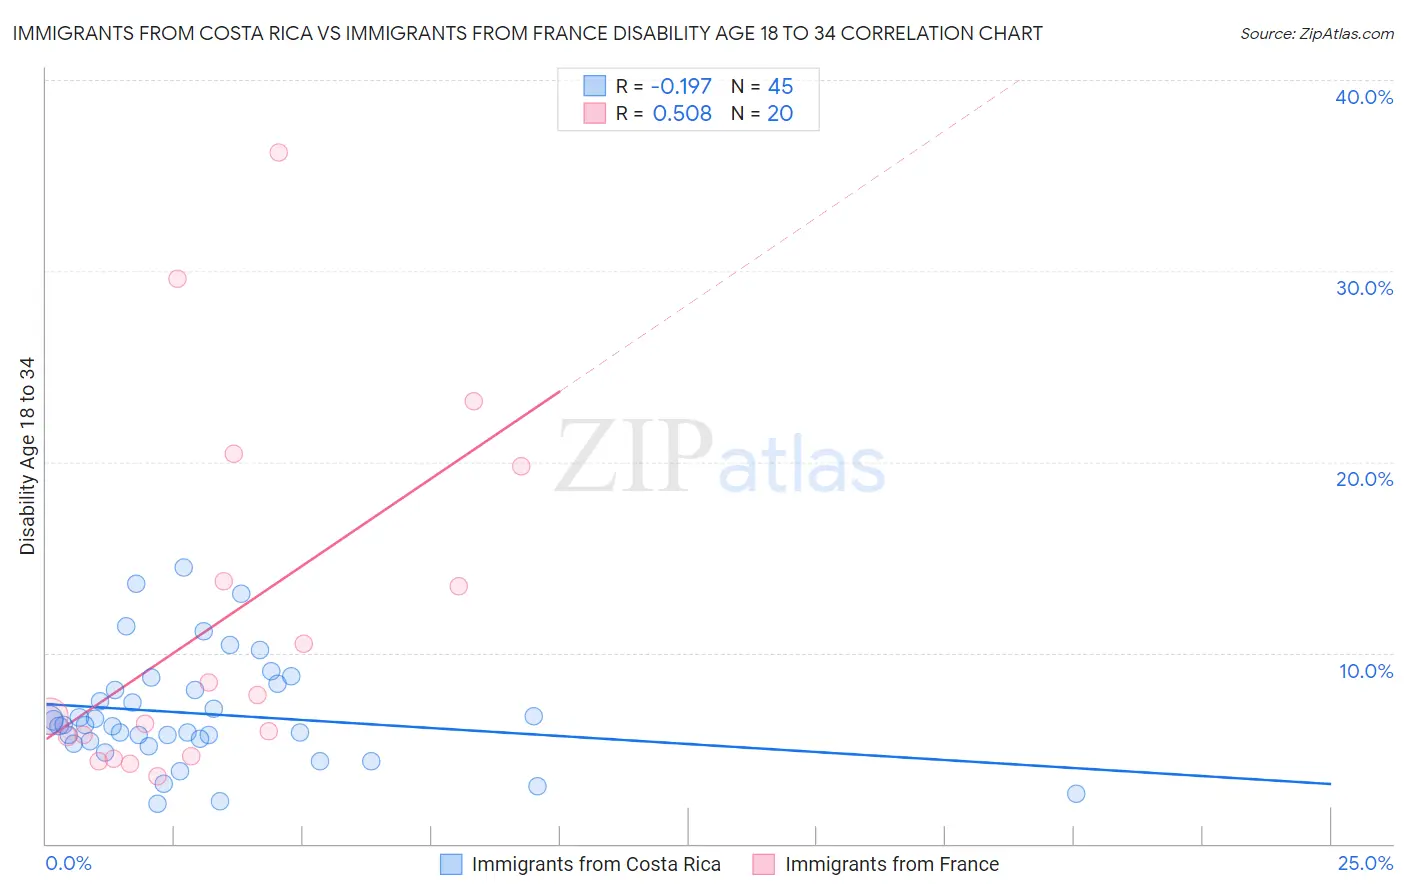
Immigrants from Costa Rica vs Immigrants from France Disability Age 18 to 34 Correlation Chart
The statistical analysis conducted on geographies consisting of 204,150,965 people shows a poor negative correlation between the proportion of Immigrants from Costa Rica and percentage of population with a disability between the ages 18 and 35 in the United States with a correlation coefficient (R) of -0.197 and weighted average of 6.3%. Similarly, the statistical analysis conducted on geographies consisting of 287,366,700 people shows a substantial positive correlation between the proportion of Immigrants from France and percentage of population with a disability between the ages 18 and 35 in the United States with a correlation coefficient (R) of 0.508 and weighted average of 6.3%, a difference of 0.42%.
Disability Age 18 to 34 Correlation Summary
| Measurement | Immigrants from Costa Rica | Immigrants from France |
| Minimum | 2.1% | 3.5% |
| Maximum | 14.5% | 36.2% |
| Range | 12.4% | 32.7% |
| Mean | 6.8% | 11.7% |
| Median | 6.2% | 7.2% |
| Interquartile 25% (IQ1) | 5.3% | 5.1% |
| Interquartile 75% (IQ3) | 8.2% | 16.8% |
| Interquartile Range (IQR) | 2.9% | 11.7% |
| Standard Deviation (Sample) | 2.9% | 9.4% |
| Standard Deviation (Population) | 2.8% | 9.1% |
Demographics Similar to Immigrants from Costa Rica and Immigrants from France by Disability Age 18 to 34
In terms of disability age 18 to 34, the demographic groups most similar to Immigrants from Costa Rica are Immigrants from Jordan (6.3%, a difference of 0.0%), Korean (6.3%, a difference of 0.030%), Immigrants from Nepal (6.3%, a difference of 0.10%), Immigrants from South Eastern Asia (6.3%, a difference of 0.15%), and Chilean (6.3%, a difference of 0.15%). Similarly, the demographic groups most similar to Immigrants from France are Immigrants from Brazil (6.3%, a difference of 0.0%), Immigrants from Romania (6.3%, a difference of 0.090%), Immigrants from Latin America (6.3%, a difference of 0.090%), Sri Lankan (6.2%, a difference of 0.16%), and Immigrants from Croatia (6.2%, a difference of 0.22%).
| Demographics | Rating | Rank | Disability Age 18 to 34 |
| Immigrants | Bulgaria | 96.3 /100 | #103 | Exceptional 6.2% |
| Mongolians | 96.2 /100 | #104 | Exceptional 6.2% |
| Bhutanese | 96.2 /100 | #105 | Exceptional 6.2% |
| Immigrants | Afghanistan | 95.9 /100 | #106 | Exceptional 6.2% |
| Ethiopians | 95.8 /100 | #107 | Exceptional 6.2% |
| Immigrants | Croatia | 95.7 /100 | #108 | Exceptional 6.2% |
| Sri Lankans | 95.5 /100 | #109 | Exceptional 6.2% |
| Immigrants | Brazil | 95.2 /100 | #110 | Exceptional 6.3% |
| Immigrants | France | 95.1 /100 | #111 | Exceptional 6.3% |
| Immigrants | Romania | 94.9 /100 | #112 | Exceptional 6.3% |
| Immigrants | Latin America | 94.9 /100 | #113 | Exceptional 6.3% |
| Immigrants | South Eastern Asia | 94.4 /100 | #114 | Exceptional 6.3% |
| Koreans | 94.1 /100 | #115 | Exceptional 6.3% |
| Immigrants | Costa Rica | 94.0 /100 | #116 | Exceptional 6.3% |
| Immigrants | Jordan | 94.0 /100 | #117 | Exceptional 6.3% |
| Immigrants | Nepal | 93.7 /100 | #118 | Exceptional 6.3% |
| Chileans | 93.5 /100 | #119 | Exceptional 6.3% |
| Immigrants | Ukraine | 93.4 /100 | #120 | Exceptional 6.3% |
| Immigrants | Guatemala | 93.4 /100 | #121 | Exceptional 6.3% |
| Immigrants | Czechoslovakia | 93.3 /100 | #122 | Exceptional 6.3% |
| Costa Ricans | 92.9 /100 | #123 | Exceptional 6.3% |