Immigrants from Congo vs Immigrants from Singapore Disability Age 35 to 64
COMPARE
Immigrants from Congo
Immigrants from Singapore
Disability Age 35 to 64
Disability Age 35 to 64 Comparison
Immigrants from Congo
Immigrants from Singapore
13.3%
DISABILITY AGE 35 TO 64
0.0/ 100
METRIC RATING
291st/ 347
METRIC RANK
8.9%
DISABILITY AGE 35 TO 64
100.0/ 100
METRIC RATING
14th/ 347
METRIC RANK
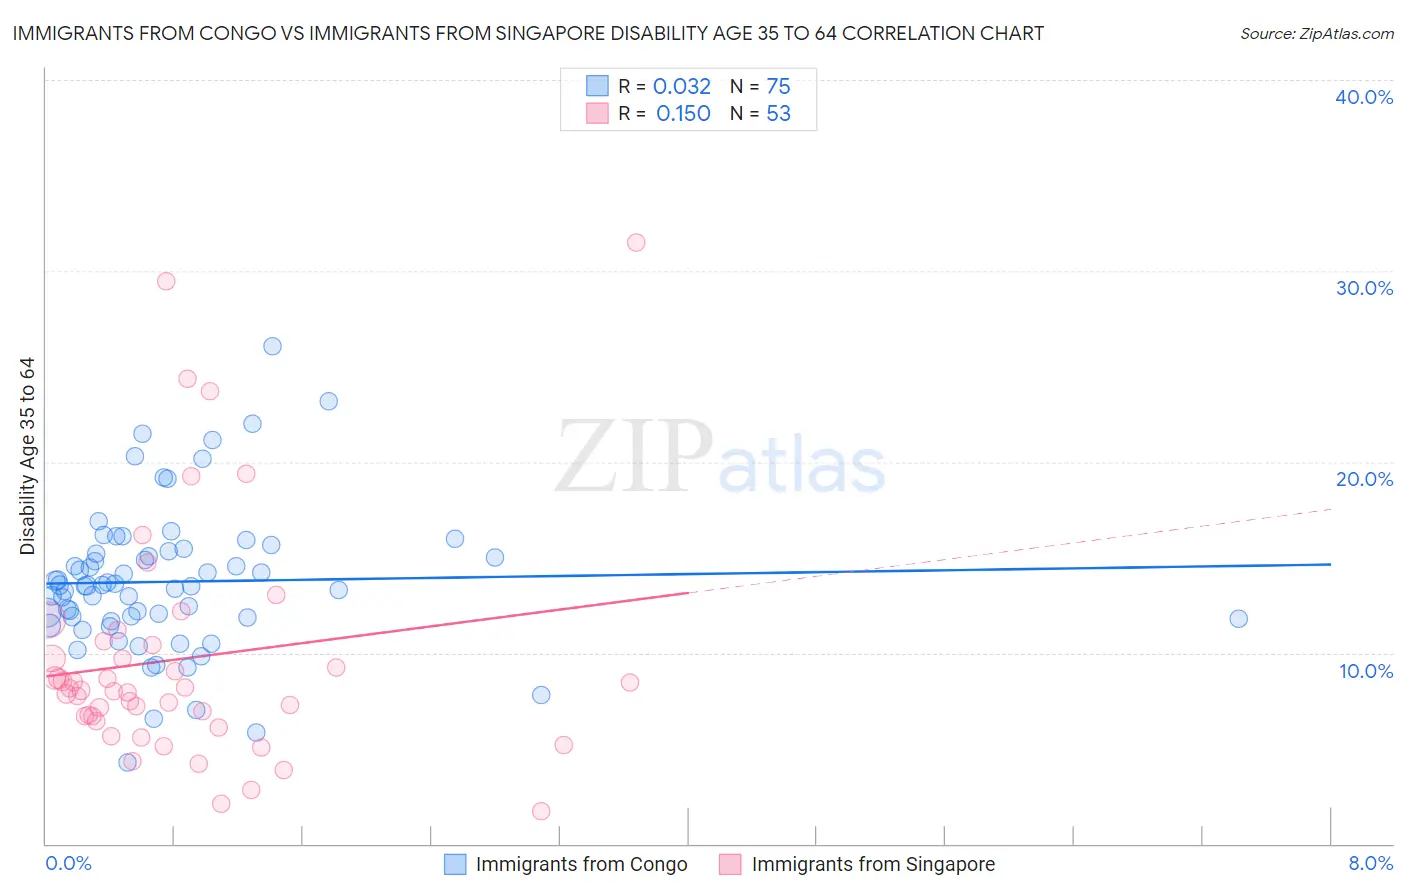
Immigrants from Congo vs Immigrants from Singapore Disability Age 35 to 64 Correlation Chart
The statistical analysis conducted on geographies consisting of 92,070,909 people shows no correlation between the proportion of Immigrants from Congo and percentage of population with a disability between the ages 34 and 64 in the United States with a correlation coefficient (R) of 0.032 and weighted average of 13.3%. Similarly, the statistical analysis conducted on geographies consisting of 137,428,870 people shows a poor positive correlation between the proportion of Immigrants from Singapore and percentage of population with a disability between the ages 34 and 64 in the United States with a correlation coefficient (R) of 0.150 and weighted average of 8.9%, a difference of 49.3%.
Disability Age 35 to 64 Correlation Summary
| Measurement | Immigrants from Congo | Immigrants from Singapore |
| Minimum | 4.3% | 1.7% |
| Maximum | 26.1% | 31.5% |
| Range | 21.8% | 29.8% |
| Mean | 13.7% | 9.7% |
| Median | 13.5% | 8.0% |
| Interquartile 25% (IQ1) | 11.8% | 6.5% |
| Interquartile 75% (IQ3) | 15.3% | 10.5% |
| Interquartile Range (IQR) | 3.5% | 4.0% |
| Standard Deviation (Sample) | 3.9% | 6.2% |
| Standard Deviation (Population) | 3.8% | 6.2% |
Similar Demographics by Disability Age 35 to 64
Demographics Similar to Immigrants from Congo by Disability Age 35 to 64
In terms of disability age 35 to 64, the demographic groups most similar to Immigrants from Congo are Puget Sound Salish (13.3%, a difference of 0.050%), Immigrants from Liberia (13.2%, a difference of 0.51%), Ute (13.4%, a difference of 0.52%), Indonesian (13.2%, a difference of 0.59%), and Fijian (13.2%, a difference of 0.66%).
| Demographics | Rating | Rank | Disability Age 35 to 64 |
| Immigrants | Nonimmigrants | 0.0 /100 | #284 | Tragic 13.0% |
| Immigrants | Somalia | 0.0 /100 | #285 | Tragic 13.1% |
| Hmong | 0.0 /100 | #286 | Tragic 13.1% |
| Tlingit-Haida | 0.0 /100 | #287 | Tragic 13.2% |
| Fijians | 0.0 /100 | #288 | Tragic 13.2% |
| Indonesians | 0.0 /100 | #289 | Tragic 13.2% |
| Immigrants | Liberia | 0.0 /100 | #290 | Tragic 13.2% |
| Immigrants | Congo | 0.0 /100 | #291 | Tragic 13.3% |
| Puget Sound Salish | 0.0 /100 | #292 | Tragic 13.3% |
| Ute | 0.0 /100 | #293 | Tragic 13.4% |
| Yaqui | 0.0 /100 | #294 | Tragic 13.5% |
| Yakama | 0.0 /100 | #295 | Tragic 13.6% |
| Africans | 0.0 /100 | #296 | Tragic 13.6% |
| Bangladeshis | 0.0 /100 | #297 | Tragic 13.6% |
| Cheyenne | 0.0 /100 | #298 | Tragic 13.6% |
Demographics Similar to Immigrants from Singapore by Disability Age 35 to 64
In terms of disability age 35 to 64, the demographic groups most similar to Immigrants from Singapore are Bolivian (8.9%, a difference of 0.29%), Immigrants from South Central Asia (8.9%, a difference of 0.60%), Immigrants from Korea (9.0%, a difference of 0.63%), Indian (Asian) (8.9%, a difference of 0.69%), and Immigrants from Eastern Asia (8.8%, a difference of 1.5%).
| Demographics | Rating | Rank | Disability Age 35 to 64 |
| Immigrants | Israel | 100.0 /100 | #7 | Exceptional 8.6% |
| Iranians | 100.0 /100 | #8 | Exceptional 8.7% |
| Immigrants | China | 100.0 /100 | #9 | Exceptional 8.7% |
| Immigrants | Bolivia | 100.0 /100 | #10 | Exceptional 8.7% |
| Immigrants | Eastern Asia | 100.0 /100 | #11 | Exceptional 8.8% |
| Indians (Asian) | 100.0 /100 | #12 | Exceptional 8.9% |
| Immigrants | South Central Asia | 100.0 /100 | #13 | Exceptional 8.9% |
| Immigrants | Singapore | 100.0 /100 | #14 | Exceptional 8.9% |
| Bolivians | 100.0 /100 | #15 | Exceptional 8.9% |
| Immigrants | Korea | 100.0 /100 | #16 | Exceptional 9.0% |
| Burmese | 100.0 /100 | #17 | Exceptional 9.2% |
| Soviet Union | 100.0 /100 | #18 | Exceptional 9.2% |
| Immigrants | Venezuela | 100.0 /100 | #19 | Exceptional 9.3% |
| Immigrants | Argentina | 100.0 /100 | #20 | Exceptional 9.3% |
| Okinawans | 100.0 /100 | #21 | Exceptional 9.4% |