Immigrants from Cameroon vs Immigrants from Turkey Disability Age Over 75
COMPARE
Immigrants from Cameroon
Immigrants from Turkey
Disability Age Over 75
Disability Age Over 75 Comparison
Immigrants from Cameroon
Immigrants from Turkey
46.4%
DISABILITY AGE OVER 75
96.9/ 100
METRIC RATING
105th/ 347
METRIC RANK
45.9%
DISABILITY AGE OVER 75
99.6/ 100
METRIC RATING
57th/ 347
METRIC RANK
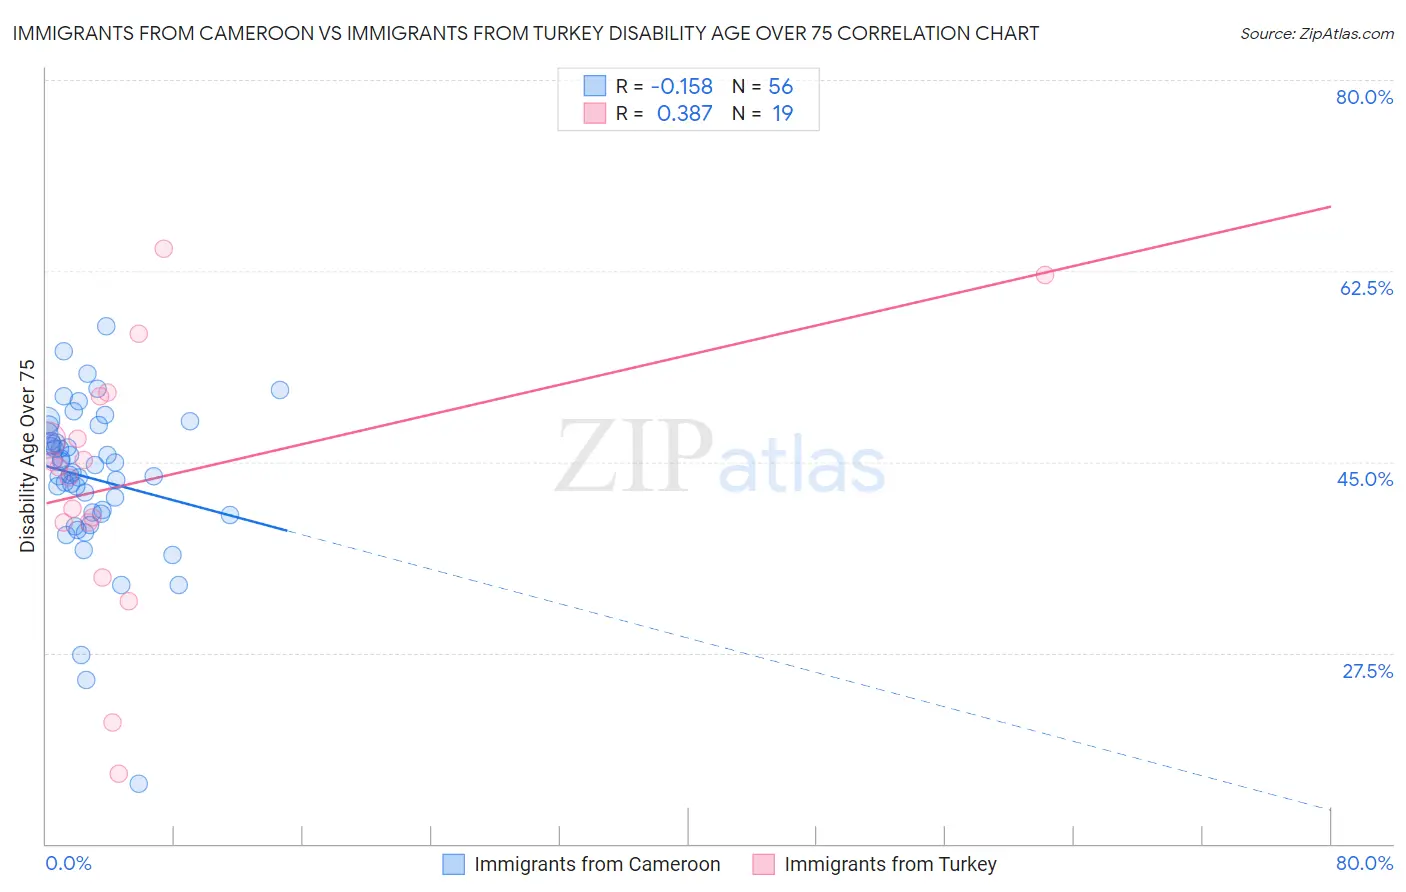
Immigrants from Cameroon vs Immigrants from Turkey Disability Age Over 75 Correlation Chart
The statistical analysis conducted on geographies consisting of 130,611,949 people shows a poor negative correlation between the proportion of Immigrants from Cameroon and percentage of population with a disability over the age of 75 in the United States with a correlation coefficient (R) of -0.158 and weighted average of 46.4%. Similarly, the statistical analysis conducted on geographies consisting of 222,857,012 people shows a mild positive correlation between the proportion of Immigrants from Turkey and percentage of population with a disability over the age of 75 in the United States with a correlation coefficient (R) of 0.387 and weighted average of 45.9%, a difference of 1.2%.
Disability Age Over 75 Correlation Summary
| Measurement | Immigrants from Cameroon | Immigrants from Turkey |
| Minimum | 15.5% | 16.4% |
| Maximum | 57.5% | 64.6% |
| Range | 42.0% | 48.1% |
| Mean | 43.5% | 43.3% |
| Median | 44.4% | 44.5% |
| Interquartile 25% (IQ1) | 40.3% | 39.4% |
| Interquartile 75% (IQ3) | 47.3% | 51.0% |
| Interquartile Range (IQR) | 7.0% | 11.6% |
| Standard Deviation (Sample) | 7.1% | 12.1% |
| Standard Deviation (Population) | 7.0% | 11.7% |
Similar Demographics by Disability Age Over 75
Demographics Similar to Immigrants from Cameroon by Disability Age Over 75
In terms of disability age over 75, the demographic groups most similar to Immigrants from Cameroon are Immigrants from Kuwait (46.4%, a difference of 0.010%), Israeli (46.4%, a difference of 0.020%), Ukrainian (46.4%, a difference of 0.040%), Immigrants from Malaysia (46.4%, a difference of 0.050%), and Immigrants from Uruguay (46.4%, a difference of 0.050%).
| Demographics | Rating | Rank | Disability Age Over 75 |
| Immigrants | Japan | 97.8 /100 | #98 | Exceptional 46.3% |
| Palestinians | 97.7 /100 | #99 | Exceptional 46.3% |
| Immigrants | Eastern Europe | 97.7 /100 | #100 | Exceptional 46.3% |
| Mongolians | 97.7 /100 | #101 | Exceptional 46.3% |
| Immigrants | Malaysia | 97.1 /100 | #102 | Exceptional 46.4% |
| Ukrainians | 97.1 /100 | #103 | Exceptional 46.4% |
| Israelis | 97.0 /100 | #104 | Exceptional 46.4% |
| Immigrants | Cameroon | 96.9 /100 | #105 | Exceptional 46.4% |
| Immigrants | Kuwait | 96.8 /100 | #106 | Exceptional 46.4% |
| Immigrants | Uruguay | 96.7 /100 | #107 | Exceptional 46.4% |
| Brazilians | 96.6 /100 | #108 | Exceptional 46.5% |
| Chileans | 96.4 /100 | #109 | Exceptional 46.5% |
| Immigrants | Hong Kong | 96.4 /100 | #110 | Exceptional 46.5% |
| Immigrants | Chile | 96.4 /100 | #111 | Exceptional 46.5% |
| Immigrants | Pakistan | 96.1 /100 | #112 | Exceptional 46.5% |
Demographics Similar to Immigrants from Turkey by Disability Age Over 75
In terms of disability age over 75, the demographic groups most similar to Immigrants from Turkey are Immigrants from Israel (45.9%, a difference of 0.0%), Immigrants from Netherlands (45.9%, a difference of 0.010%), Iranian (45.9%, a difference of 0.010%), Immigrants from Europe (45.9%, a difference of 0.010%), and Immigrants from Argentina (45.9%, a difference of 0.040%).
| Demographics | Rating | Rank | Disability Age Over 75 |
| Belgians | 99.7 /100 | #50 | Exceptional 45.8% |
| Immigrants | Korea | 99.7 /100 | #51 | Exceptional 45.8% |
| Immigrants | France | 99.7 /100 | #52 | Exceptional 45.8% |
| Immigrants | Italy | 99.7 /100 | #53 | Exceptional 45.8% |
| Slovaks | 99.6 /100 | #54 | Exceptional 45.8% |
| Maltese | 99.6 /100 | #55 | Exceptional 45.8% |
| Immigrants | Netherlands | 99.6 /100 | #56 | Exceptional 45.9% |
| Immigrants | Turkey | 99.6 /100 | #57 | Exceptional 45.9% |
| Immigrants | Israel | 99.6 /100 | #58 | Exceptional 45.9% |
| Iranians | 99.6 /100 | #59 | Exceptional 45.9% |
| Immigrants | Europe | 99.6 /100 | #60 | Exceptional 45.9% |
| Immigrants | Argentina | 99.6 /100 | #61 | Exceptional 45.9% |
| Burmese | 99.5 /100 | #62 | Exceptional 45.9% |
| Immigrants | Norway | 99.5 /100 | #63 | Exceptional 45.9% |
| Immigrants | North Macedonia | 99.5 /100 | #64 | Exceptional 45.9% |