Immigrants from Brazil vs Bhutanese Disability Age 35 to 64
COMPARE
Immigrants from Brazil
Bhutanese
Disability Age 35 to 64
Disability Age 35 to 64 Comparison
Immigrants from Brazil
Bhutanese
10.2%
DISABILITY AGE 35 TO 64
99.2/ 100
METRIC RATING
83rd/ 347
METRIC RANK
9.8%
DISABILITY AGE 35 TO 64
99.8/ 100
METRIC RATING
51st/ 347
METRIC RANK
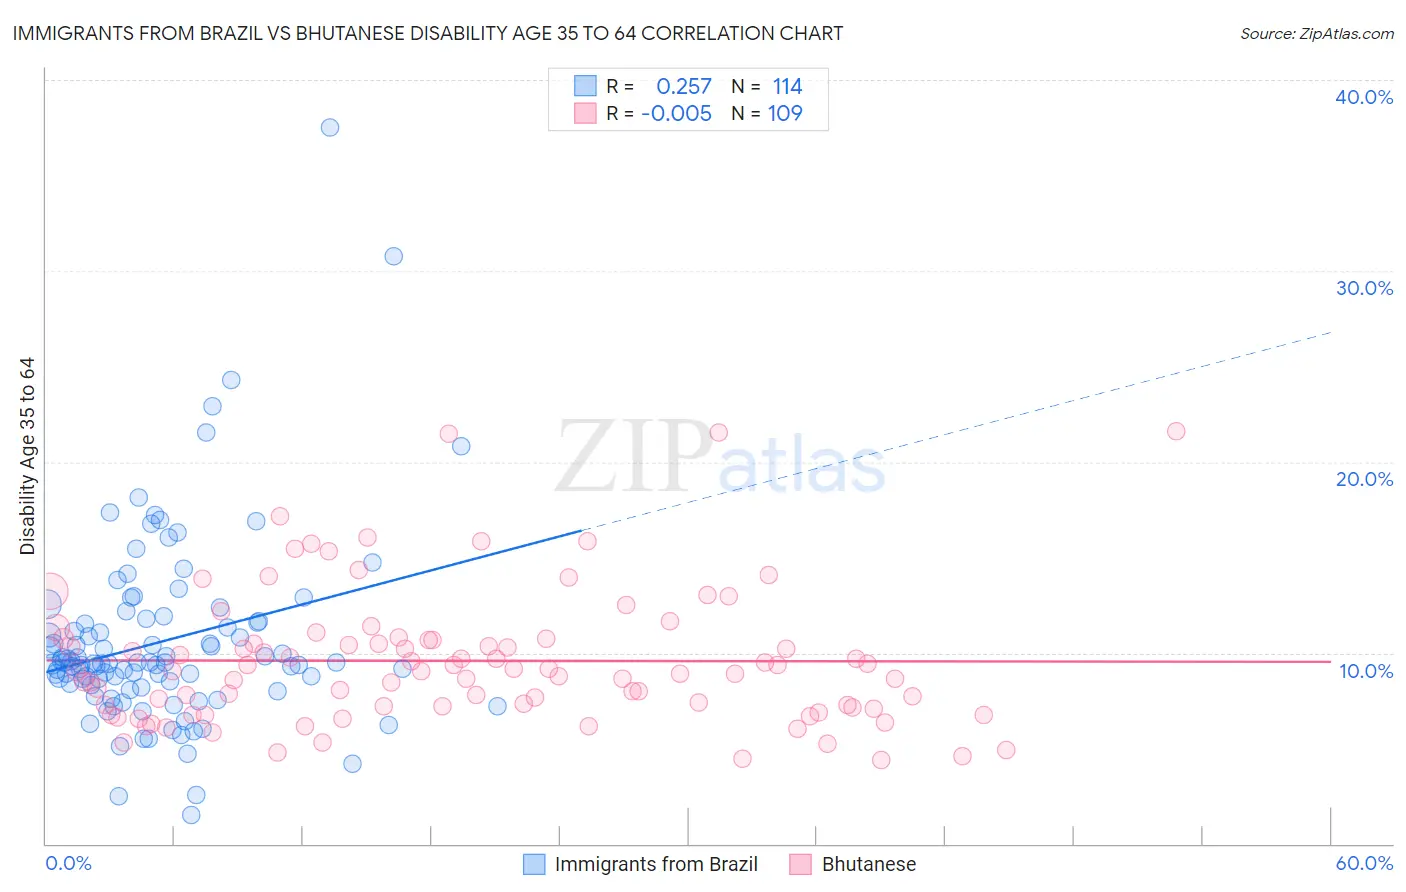
Immigrants from Brazil vs Bhutanese Disability Age 35 to 64 Correlation Chart
The statistical analysis conducted on geographies consisting of 342,837,790 people shows a weak positive correlation between the proportion of Immigrants from Brazil and percentage of population with a disability between the ages 34 and 64 in the United States with a correlation coefficient (R) of 0.257 and weighted average of 10.2%. Similarly, the statistical analysis conducted on geographies consisting of 455,064,702 people shows no correlation between the proportion of Bhutanese and percentage of population with a disability between the ages 34 and 64 in the United States with a correlation coefficient (R) of -0.005 and weighted average of 9.8%, a difference of 3.5%.
Disability Age 35 to 64 Correlation Summary
| Measurement | Immigrants from Brazil | Bhutanese |
| Minimum | 1.5% | 4.4% |
| Maximum | 37.5% | 21.6% |
| Range | 36.0% | 17.2% |
| Mean | 10.6% | 9.6% |
| Median | 9.5% | 9.0% |
| Interquartile 25% (IQ1) | 8.3% | 7.2% |
| Interquartile 75% (IQ3) | 11.7% | 10.7% |
| Interquartile Range (IQR) | 3.3% | 3.6% |
| Standard Deviation (Sample) | 5.0% | 3.5% |
| Standard Deviation (Population) | 5.0% | 3.5% |
Similar Demographics by Disability Age 35 to 64
Demographics Similar to Immigrants from Brazil by Disability Age 35 to 64
In terms of disability age 35 to 64, the demographic groups most similar to Immigrants from Brazil are Russian (10.2%, a difference of 0.020%), Sri Lankan (10.2%, a difference of 0.060%), Latvian (10.2%, a difference of 0.070%), Immigrants from Croatia (10.2%, a difference of 0.17%), and Immigrants from Kuwait (10.2%, a difference of 0.27%).
| Demographics | Rating | Rank | Disability Age 35 to 64 |
| Immigrants | Chile | 99.4 /100 | #76 | Exceptional 10.1% |
| Mongolians | 99.4 /100 | #77 | Exceptional 10.1% |
| Jordanians | 99.3 /100 | #78 | Exceptional 10.1% |
| Immigrants | Vietnam | 99.3 /100 | #79 | Exceptional 10.1% |
| Immigrants | Croatia | 99.3 /100 | #80 | Exceptional 10.2% |
| Latvians | 99.2 /100 | #81 | Exceptional 10.2% |
| Russians | 99.2 /100 | #82 | Exceptional 10.2% |
| Immigrants | Brazil | 99.2 /100 | #83 | Exceptional 10.2% |
| Sri Lankans | 99.2 /100 | #84 | Exceptional 10.2% |
| Immigrants | Kuwait | 99.1 /100 | #85 | Exceptional 10.2% |
| Immigrants | Europe | 99.1 /100 | #86 | Exceptional 10.2% |
| Nicaraguans | 99.1 /100 | #87 | Exceptional 10.2% |
| Chileans | 99.0 /100 | #88 | Exceptional 10.2% |
| Uruguayans | 99.0 /100 | #89 | Exceptional 10.2% |
| Afghans | 98.9 /100 | #90 | Exceptional 10.3% |
Demographics Similar to Bhutanese by Disability Age 35 to 64
In terms of disability age 35 to 64, the demographic groups most similar to Bhutanese are Immigrants from Bulgaria (9.8%, a difference of 0.010%), Taiwanese (9.8%, a difference of 0.070%), Paraguayan (9.8%, a difference of 0.080%), Immigrants from Russia (9.8%, a difference of 0.11%), and Immigrants from Greece (9.8%, a difference of 0.15%).
| Demographics | Rating | Rank | Disability Age 35 to 64 |
| Immigrants | Egypt | 99.9 /100 | #44 | Exceptional 9.8% |
| Immigrants | Peru | 99.9 /100 | #45 | Exceptional 9.8% |
| Cambodians | 99.8 /100 | #46 | Exceptional 9.8% |
| Immigrants | Belgium | 99.8 /100 | #47 | Exceptional 9.8% |
| Immigrants | Serbia | 99.8 /100 | #48 | Exceptional 9.8% |
| Immigrants | Greece | 99.8 /100 | #49 | Exceptional 9.8% |
| Paraguayans | 99.8 /100 | #50 | Exceptional 9.8% |
| Bhutanese | 99.8 /100 | #51 | Exceptional 9.8% |
| Immigrants | Bulgaria | 99.8 /100 | #52 | Exceptional 9.8% |
| Taiwanese | 99.8 /100 | #53 | Exceptional 9.8% |
| Immigrants | Russia | 99.8 /100 | #54 | Exceptional 9.8% |
| Peruvians | 99.8 /100 | #55 | Exceptional 9.9% |
| South Americans | 99.8 /100 | #56 | Exceptional 9.9% |
| Colombians | 99.8 /100 | #57 | Exceptional 9.9% |
| Armenians | 99.8 /100 | #58 | Exceptional 9.9% |