Immigrants from Belarus vs Hawaiian Cognitive Disability
COMPARE
Immigrants from Belarus
Hawaiian
Cognitive Disability
Cognitive Disability Comparison
Immigrants from Belarus
Hawaiians
16.5%
COGNITIVE DISABILITY
99.9/ 100
METRIC RATING
40th/ 347
METRIC RANK
17.6%
COGNITIVE DISABILITY
7.2/ 100
METRIC RATING
213th/ 347
METRIC RANK
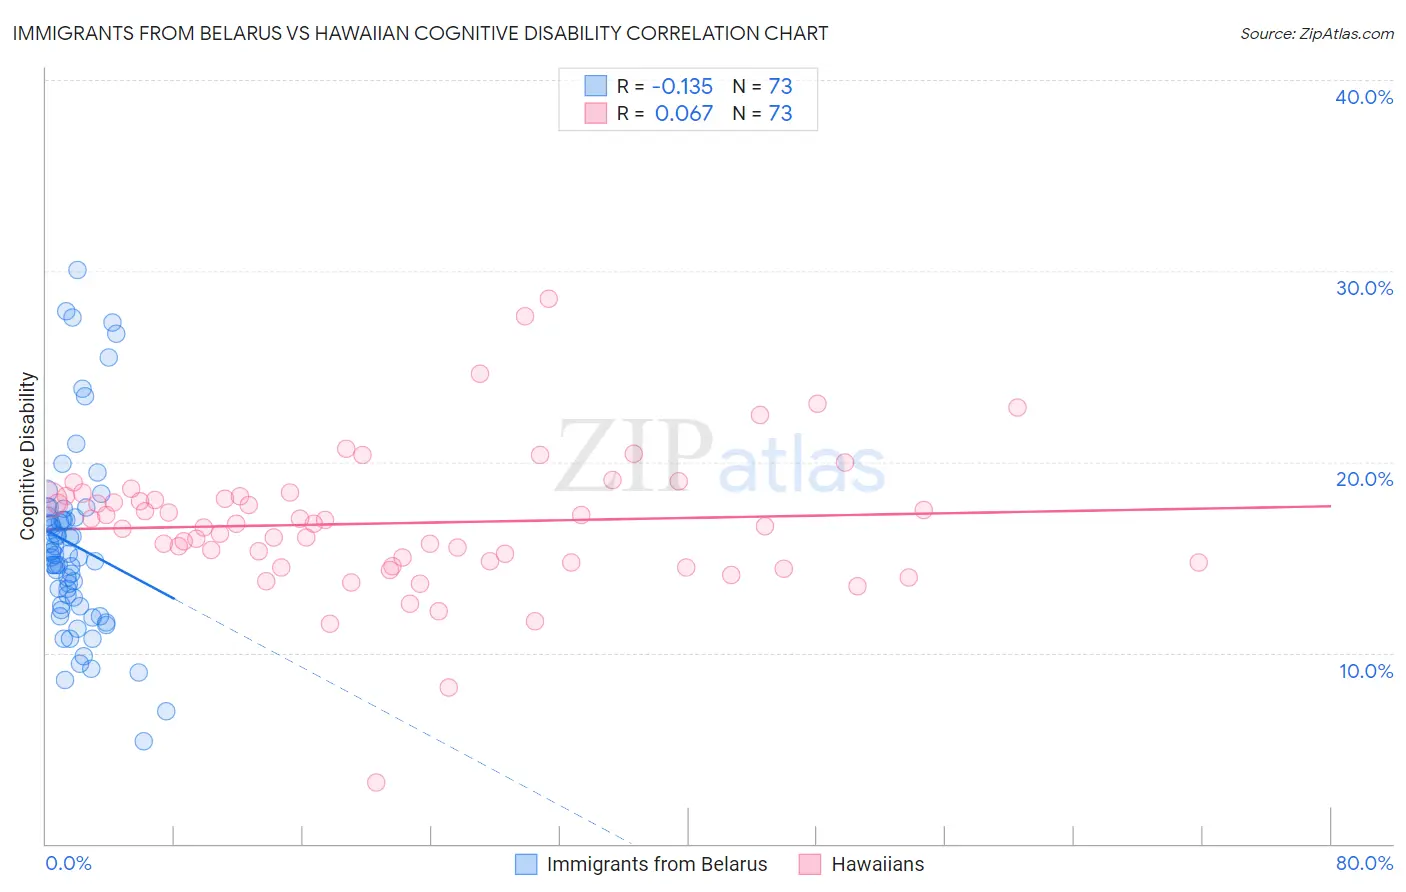
Immigrants from Belarus vs Hawaiian Cognitive Disability Correlation Chart
The statistical analysis conducted on geographies consisting of 150,194,359 people shows a poor negative correlation between the proportion of Immigrants from Belarus and percentage of population with cognitive disability in the United States with a correlation coefficient (R) of -0.135 and weighted average of 16.5%. Similarly, the statistical analysis conducted on geographies consisting of 327,505,207 people shows a slight positive correlation between the proportion of Hawaiians and percentage of population with cognitive disability in the United States with a correlation coefficient (R) of 0.067 and weighted average of 17.6%, a difference of 6.8%.
Cognitive Disability Correlation Summary
| Measurement | Immigrants from Belarus | Hawaiian |
| Minimum | 5.4% | 3.2% |
| Maximum | 30.1% | 28.6% |
| Range | 24.7% | 25.4% |
| Mean | 15.6% | 16.8% |
| Median | 15.1% | 16.8% |
| Interquartile 25% (IQ1) | 12.5% | 14.7% |
| Interquartile 75% (IQ3) | 17.1% | 18.2% |
| Interquartile Range (IQR) | 4.6% | 3.5% |
| Standard Deviation (Sample) | 4.9% | 3.7% |
| Standard Deviation (Population) | 4.9% | 3.7% |
Similar Demographics by Cognitive Disability
Demographics Similar to Immigrants from Belarus by Cognitive Disability
In terms of cognitive disability, the demographic groups most similar to Immigrants from Belarus are Cuban (16.5%, a difference of 0.0%), Bolivian (16.5%, a difference of 0.010%), Hungarian (16.5%, a difference of 0.020%), Immigrants from Canada (16.5%, a difference of 0.080%), and Immigrants from Eastern Europe (16.5%, a difference of 0.090%).
| Demographics | Rating | Rank | Cognitive Disability |
| Italians | 99.9 /100 | #33 | Exceptional 16.4% |
| Russians | 99.9 /100 | #34 | Exceptional 16.4% |
| Slovaks | 99.9 /100 | #35 | Exceptional 16.4% |
| Greeks | 99.9 /100 | #36 | Exceptional 16.4% |
| Slovenes | 99.9 /100 | #37 | Exceptional 16.5% |
| Immigrants | Eastern Europe | 99.9 /100 | #38 | Exceptional 16.5% |
| Bolivians | 99.9 /100 | #39 | Exceptional 16.5% |
| Immigrants | Belarus | 99.9 /100 | #40 | Exceptional 16.5% |
| Cubans | 99.9 /100 | #41 | Exceptional 16.5% |
| Hungarians | 99.9 /100 | #42 | Exceptional 16.5% |
| Immigrants | Canada | 99.8 /100 | #43 | Exceptional 16.5% |
| Macedonians | 99.8 /100 | #44 | Exceptional 16.5% |
| Immigrants | Europe | 99.8 /100 | #45 | Exceptional 16.5% |
| Immigrants | Colombia | 99.8 /100 | #46 | Exceptional 16.5% |
| Immigrants | Italy | 99.8 /100 | #47 | Exceptional 16.5% |
Demographics Similar to Hawaiians by Cognitive Disability
In terms of cognitive disability, the demographic groups most similar to Hawaiians are Immigrants from Oceania (17.6%, a difference of 0.010%), Immigrants from El Salvador (17.6%, a difference of 0.020%), Alaskan Athabascan (17.6%, a difference of 0.030%), Okinawan (17.6%, a difference of 0.040%), and Taiwanese (17.6%, a difference of 0.050%).
| Demographics | Rating | Rank | Cognitive Disability |
| Alaska Natives | 10.4 /100 | #206 | Poor 17.5% |
| Immigrants | Latin America | 9.7 /100 | #207 | Tragic 17.6% |
| Immigrants | Cameroon | 9.3 /100 | #208 | Tragic 17.6% |
| Immigrants | Trinidad and Tobago | 8.7 /100 | #209 | Tragic 17.6% |
| Immigrants | Jamaica | 8.5 /100 | #210 | Tragic 17.6% |
| Taiwanese | 7.7 /100 | #211 | Tragic 17.6% |
| Immigrants | Oceania | 7.3 /100 | #212 | Tragic 17.6% |
| Hawaiians | 7.2 /100 | #213 | Tragic 17.6% |
| Immigrants | El Salvador | 7.0 /100 | #214 | Tragic 17.6% |
| Alaskan Athabascans | 6.9 /100 | #215 | Tragic 17.6% |
| Okinawans | 6.8 /100 | #216 | Tragic 17.6% |
| Salvadorans | 6.7 /100 | #217 | Tragic 17.6% |
| Icelanders | 6.4 /100 | #218 | Tragic 17.6% |
| Immigrants | Sierra Leone | 6.3 /100 | #219 | Tragic 17.6% |
| Zimbabweans | 6.1 /100 | #220 | Tragic 17.6% |