Immigrants from Austria vs Paraguayan Disability Age Over 75
COMPARE
Immigrants from Austria
Paraguayan
Disability Age Over 75
Disability Age Over 75 Comparison
Immigrants from Austria
Paraguayans
44.9%
DISABILITY AGE OVER 75
100.0/ 100
METRIC RATING
8th/ 347
METRIC RANK
45.0%
DISABILITY AGE OVER 75
100.0/ 100
METRIC RATING
9th/ 347
METRIC RANK
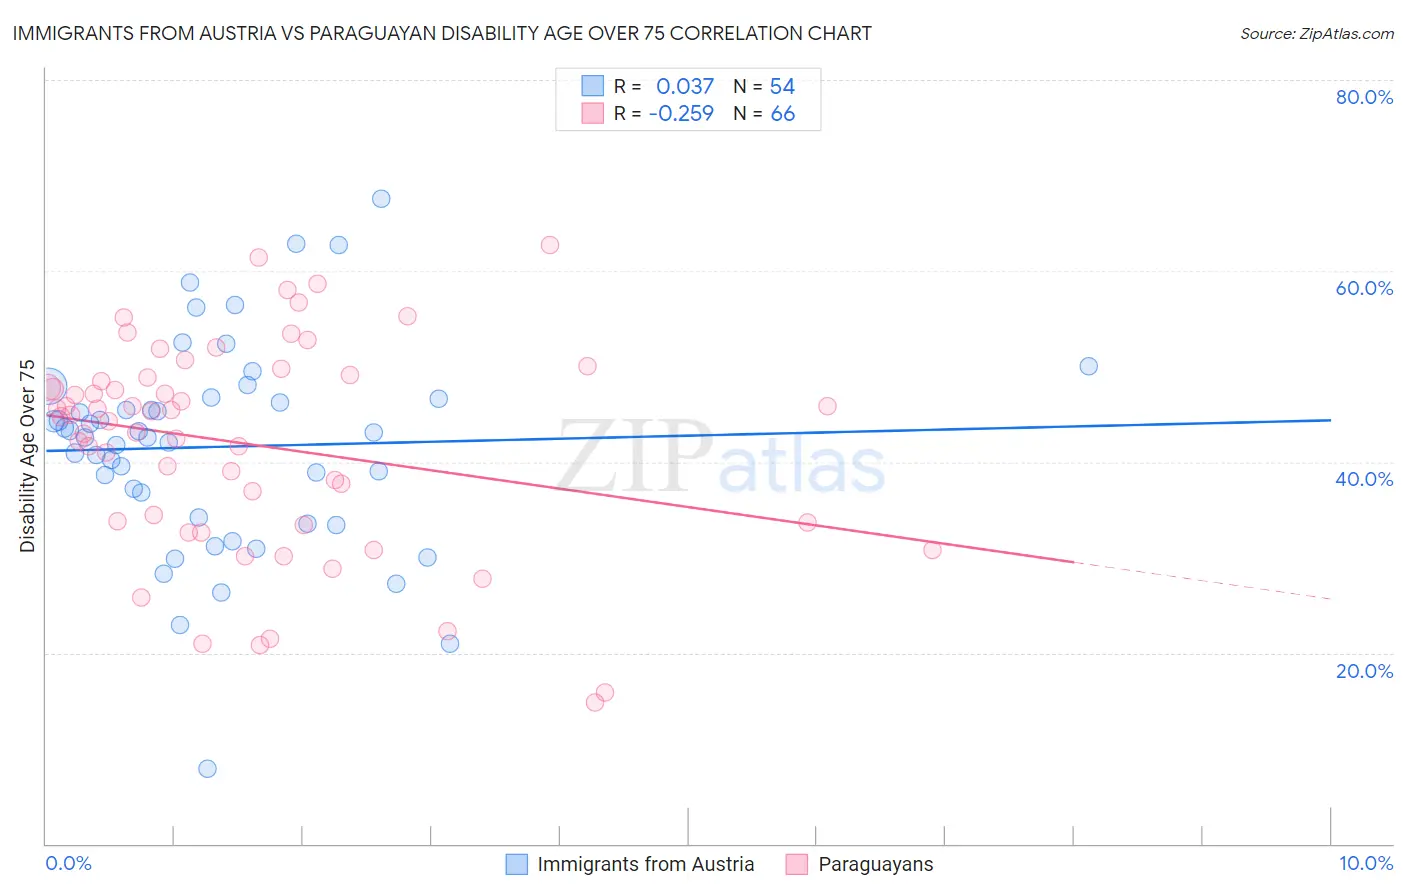
Immigrants from Austria vs Paraguayan Disability Age Over 75 Correlation Chart
The statistical analysis conducted on geographies consisting of 167,936,864 people shows no correlation between the proportion of Immigrants from Austria and percentage of population with a disability over the age of 75 in the United States with a correlation coefficient (R) of 0.037 and weighted average of 44.9%. Similarly, the statistical analysis conducted on geographies consisting of 95,066,905 people shows a weak negative correlation between the proportion of Paraguayans and percentage of population with a disability over the age of 75 in the United States with a correlation coefficient (R) of -0.259 and weighted average of 45.0%, a difference of 0.080%.
Disability Age Over 75 Correlation Summary
| Measurement | Immigrants from Austria | Paraguayan |
| Minimum | 7.8% | 14.7% |
| Maximum | 67.5% | 62.7% |
| Range | 59.7% | 48.0% |
| Mean | 41.6% | 41.8% |
| Median | 42.8% | 44.8% |
| Interquartile 25% (IQ1) | 34.2% | 33.7% |
| Interquartile 75% (IQ3) | 46.7% | 48.8% |
| Interquartile Range (IQR) | 12.5% | 15.1% |
| Standard Deviation (Sample) | 10.9% | 11.1% |
| Standard Deviation (Population) | 10.8% | 11.0% |
Demographics Similar to Immigrants from Austria and Paraguayans by Disability Age Over 75
In terms of disability age over 75, the demographic groups most similar to Immigrants from Austria are Okinawan (44.9%, a difference of 0.12%), Immigrants from Lithuania (44.9%, a difference of 0.16%), Bulgarian (45.1%, a difference of 0.24%), Luxembourger (44.8%, a difference of 0.25%), and Lithuanian (45.1%, a difference of 0.29%). Similarly, the demographic groups most similar to Paraguayans are Bulgarian (45.1%, a difference of 0.16%), Okinawan (44.9%, a difference of 0.20%), Lithuanian (45.1%, a difference of 0.21%), Immigrants from Lithuania (44.9%, a difference of 0.24%), and Immigrants from Czechoslovakia (45.1%, a difference of 0.30%).
| Demographics | Rating | Rank | Disability Age Over 75 |
| Cypriots | 100.0 /100 | #1 | Exceptional 43.5% |
| Immigrants | Ireland | 100.0 /100 | #2 | Exceptional 44.7% |
| Eastern Europeans | 100.0 /100 | #3 | Exceptional 44.8% |
| Carpatho Rusyns | 100.0 /100 | #4 | Exceptional 44.8% |
| Luxembourgers | 100.0 /100 | #5 | Exceptional 44.8% |
| Immigrants | Lithuania | 100.0 /100 | #6 | Exceptional 44.9% |
| Okinawans | 100.0 /100 | #7 | Exceptional 44.9% |
| Immigrants | Austria | 100.0 /100 | #8 | Exceptional 44.9% |
| Paraguayans | 100.0 /100 | #9 | Exceptional 45.0% |
| Bulgarians | 100.0 /100 | #10 | Exceptional 45.1% |
| Lithuanians | 100.0 /100 | #11 | Exceptional 45.1% |
| Immigrants | Czechoslovakia | 100.0 /100 | #12 | Exceptional 45.1% |
| Latvians | 100.0 /100 | #13 | Exceptional 45.1% |
| Immigrants | Scotland | 100.0 /100 | #14 | Exceptional 45.1% |
| Immigrants | Sweden | 100.0 /100 | #15 | Exceptional 45.1% |
| Immigrants | Northern Europe | 100.0 /100 | #16 | Exceptional 45.2% |
| Immigrants | India | 100.0 /100 | #17 | Exceptional 45.2% |
| Bolivians | 100.0 /100 | #18 | Exceptional 45.2% |
| Immigrants | Greece | 100.0 /100 | #19 | Exceptional 45.2% |
| Immigrants | Serbia | 100.0 /100 | #20 | Exceptional 45.3% |