Immigrants from Armenia vs Immigrants from Serbia Disability Age 35 to 64
COMPARE
Immigrants from Armenia
Immigrants from Serbia
Disability Age 35 to 64
Disability Age 35 to 64 Comparison
Immigrants from Armenia
Immigrants from Serbia
9.7%
DISABILITY AGE 35 TO 64
99.9/ 100
METRIC RATING
40th/ 347
METRIC RANK
9.8%
DISABILITY AGE 35 TO 64
99.8/ 100
METRIC RATING
48th/ 347
METRIC RANK
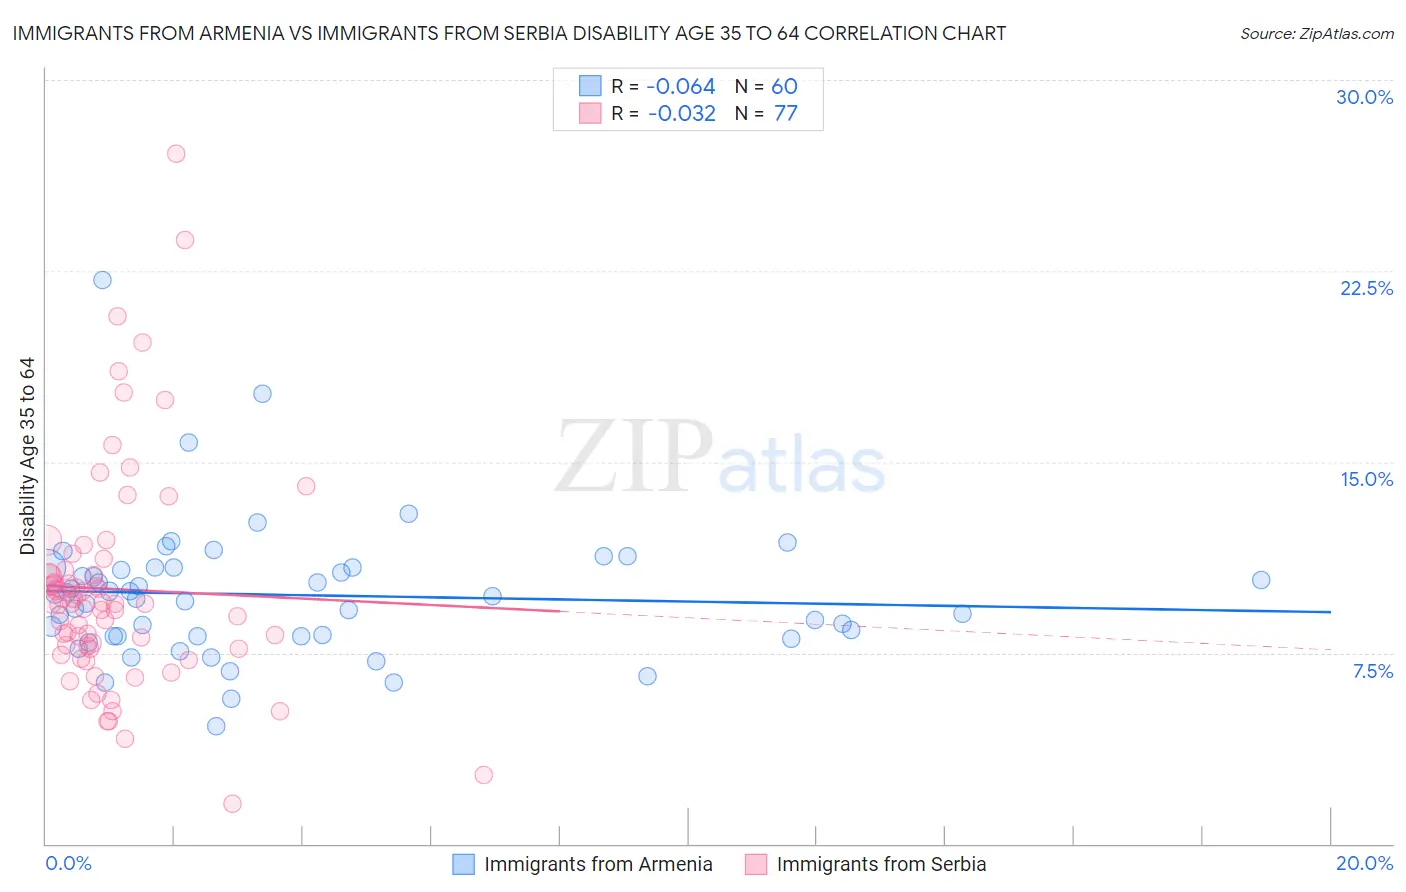
Immigrants from Armenia vs Immigrants from Serbia Disability Age 35 to 64 Correlation Chart
The statistical analysis conducted on geographies consisting of 97,707,471 people shows a slight negative correlation between the proportion of Immigrants from Armenia and percentage of population with a disability between the ages 34 and 64 in the United States with a correlation coefficient (R) of -0.064 and weighted average of 9.7%. Similarly, the statistical analysis conducted on geographies consisting of 131,722,844 people shows no correlation between the proportion of Immigrants from Serbia and percentage of population with a disability between the ages 34 and 64 in the United States with a correlation coefficient (R) of -0.032 and weighted average of 9.8%, a difference of 1.1%.
Disability Age 35 to 64 Correlation Summary
| Measurement | Immigrants from Armenia | Immigrants from Serbia |
| Minimum | 4.6% | 1.6% |
| Maximum | 22.1% | 27.1% |
| Range | 17.5% | 25.5% |
| Mean | 9.8% | 10.0% |
| Median | 9.7% | 9.4% |
| Interquartile 25% (IQ1) | 8.2% | 7.7% |
| Interquartile 75% (IQ3) | 10.8% | 10.7% |
| Interquartile Range (IQR) | 2.7% | 3.0% |
| Standard Deviation (Sample) | 2.7% | 4.4% |
| Standard Deviation (Population) | 2.7% | 4.4% |
Demographics Similar to Immigrants from Armenia and Immigrants from Serbia by Disability Age 35 to 64
In terms of disability age 35 to 64, the demographic groups most similar to Immigrants from Armenia are Immigrants from Belarus (9.7%, a difference of 0.070%), Israeli (9.7%, a difference of 0.12%), Egyptian (9.7%, a difference of 0.23%), Immigrants from Turkey (9.7%, a difference of 0.30%), and Immigrants from Malaysia (9.7%, a difference of 0.35%). Similarly, the demographic groups most similar to Immigrants from Serbia are Immigrants from Belgium (9.8%, a difference of 0.010%), Immigrants from Greece (9.8%, a difference of 0.040%), Cambodian (9.8%, a difference of 0.060%), Paraguayan (9.8%, a difference of 0.11%), and Bhutanese (9.8%, a difference of 0.20%).
| Demographics | Rating | Rank | Disability Age 35 to 64 |
| Immigrants | Australia | 99.9 /100 | #34 | Exceptional 9.7% |
| Bulgarians | 99.9 /100 | #35 | Exceptional 9.7% |
| Immigrants | Cuba | 99.9 /100 | #36 | Exceptional 9.7% |
| Immigrants | Turkey | 99.9 /100 | #37 | Exceptional 9.7% |
| Egyptians | 99.9 /100 | #38 | Exceptional 9.7% |
| Immigrants | Belarus | 99.9 /100 | #39 | Exceptional 9.7% |
| Immigrants | Armenia | 99.9 /100 | #40 | Exceptional 9.7% |
| Israelis | 99.9 /100 | #41 | Exceptional 9.7% |
| Immigrants | Malaysia | 99.9 /100 | #42 | Exceptional 9.7% |
| Immigrants | Colombia | 99.9 /100 | #43 | Exceptional 9.8% |
| Immigrants | Egypt | 99.9 /100 | #44 | Exceptional 9.8% |
| Immigrants | Peru | 99.9 /100 | #45 | Exceptional 9.8% |
| Cambodians | 99.8 /100 | #46 | Exceptional 9.8% |
| Immigrants | Belgium | 99.8 /100 | #47 | Exceptional 9.8% |
| Immigrants | Serbia | 99.8 /100 | #48 | Exceptional 9.8% |
| Immigrants | Greece | 99.8 /100 | #49 | Exceptional 9.8% |
| Paraguayans | 99.8 /100 | #50 | Exceptional 9.8% |
| Bhutanese | 99.8 /100 | #51 | Exceptional 9.8% |
| Immigrants | Bulgaria | 99.8 /100 | #52 | Exceptional 9.8% |
| Taiwanese | 99.8 /100 | #53 | Exceptional 9.8% |
| Immigrants | Russia | 99.8 /100 | #54 | Exceptional 9.8% |