French Canadian vs Immigrants from Peru Disability Age 65 to 74
COMPARE
French Canadian
Immigrants from Peru
Disability Age 65 to 74
Disability Age 65 to 74 Comparison
French Canadians
Immigrants from Peru
23.7%
DISABILITY AGE 65 TO 74
24.0/ 100
METRIC RATING
200th/ 347
METRIC RANK
22.3%
DISABILITY AGE 65 TO 74
95.7/ 100
METRIC RATING
110th/ 347
METRIC RANK
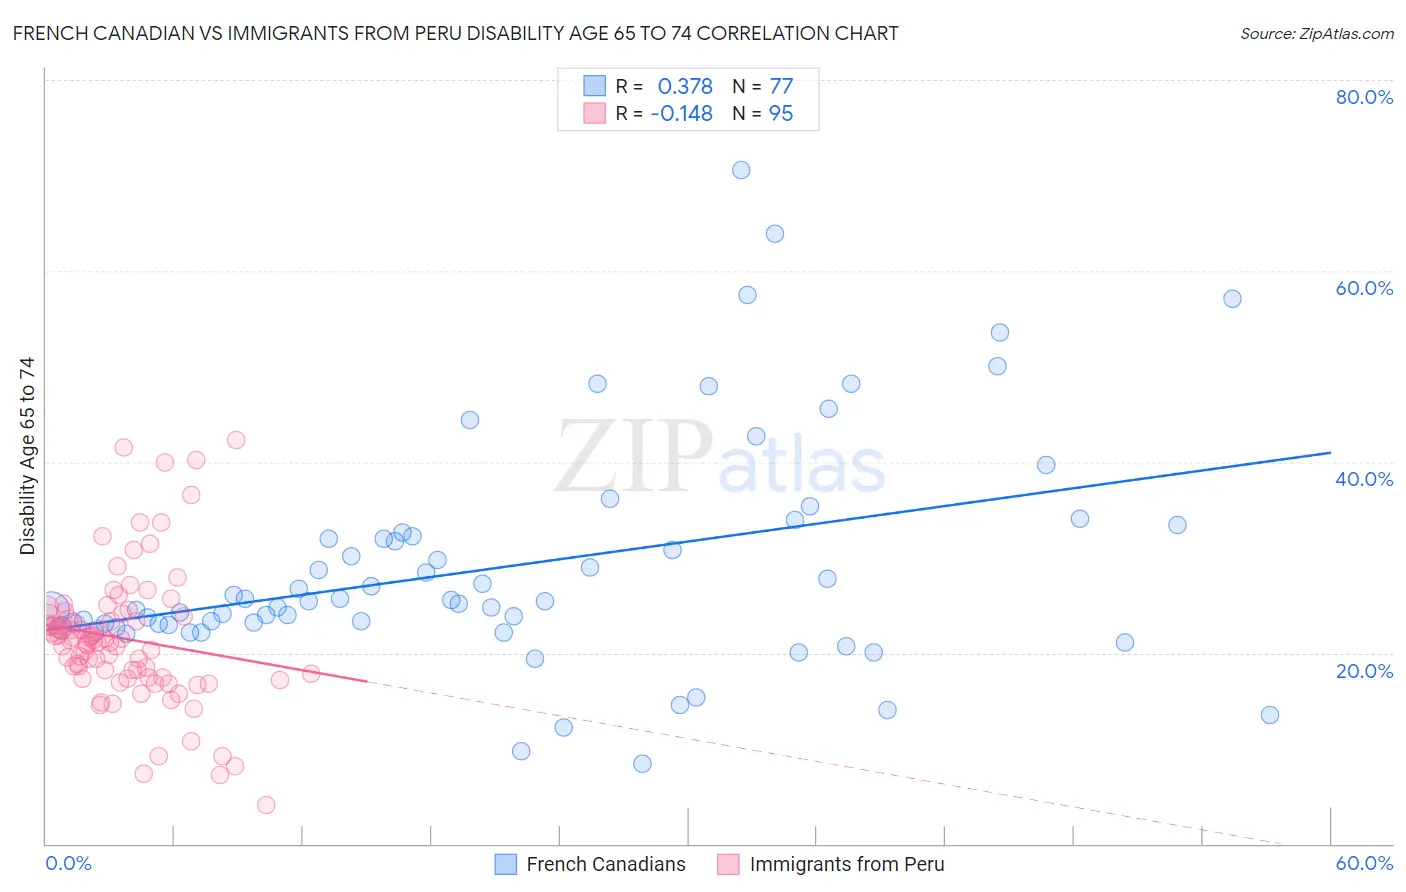
French Canadian vs Immigrants from Peru Disability Age 65 to 74 Correlation Chart
The statistical analysis conducted on geographies consisting of 501,232,357 people shows a mild positive correlation between the proportion of French Canadians and percentage of population with a disability between the ages 65 and 75 in the United States with a correlation coefficient (R) of 0.378 and weighted average of 23.7%. Similarly, the statistical analysis conducted on geographies consisting of 328,454,169 people shows a poor negative correlation between the proportion of Immigrants from Peru and percentage of population with a disability between the ages 65 and 75 in the United States with a correlation coefficient (R) of -0.148 and weighted average of 22.3%, a difference of 6.5%.
Disability Age 65 to 74 Correlation Summary
| Measurement | French Canadian | Immigrants from Peru |
| Minimum | 8.4% | 4.1% |
| Maximum | 70.6% | 42.3% |
| Range | 62.2% | 38.3% |
| Mean | 29.1% | 21.5% |
| Median | 25.4% | 21.4% |
| Interquartile 25% (IQ1) | 22.8% | 17.4% |
| Interquartile 75% (IQ3) | 32.4% | 24.0% |
| Interquartile Range (IQR) | 9.7% | 6.5% |
| Standard Deviation (Sample) | 12.0% | 7.0% |
| Standard Deviation (Population) | 11.9% | 6.9% |
Similar Demographics by Disability Age 65 to 74
Demographics Similar to French Canadians by Disability Age 65 to 74
In terms of disability age 65 to 74, the demographic groups most similar to French Canadians are Immigrants from Ecuador (23.7%, a difference of 0.010%), Welsh (23.7%, a difference of 0.030%), Immigrants from Africa (23.7%, a difference of 0.040%), Immigrants from Bahamas (23.7%, a difference of 0.050%), and Kenyan (23.7%, a difference of 0.060%).
| Demographics | Rating | Rank | Disability Age 65 to 74 |
| English | 28.5 /100 | #193 | Fair 23.6% |
| Sudanese | 27.8 /100 | #194 | Fair 23.7% |
| Immigrants | St. Vincent and the Grenadines | 26.1 /100 | #195 | Fair 23.7% |
| Immigrants | Trinidad and Tobago | 26.1 /100 | #196 | Fair 23.7% |
| Immigrants | Immigrants | 25.8 /100 | #197 | Fair 23.7% |
| Immigrants | Africa | 24.4 /100 | #198 | Fair 23.7% |
| Welsh | 24.3 /100 | #199 | Fair 23.7% |
| French Canadians | 24.0 /100 | #200 | Fair 23.7% |
| Immigrants | Ecuador | 23.9 /100 | #201 | Fair 23.7% |
| Immigrants | Bahamas | 23.3 /100 | #202 | Fair 23.7% |
| Kenyans | 23.2 /100 | #203 | Fair 23.7% |
| Immigrants | Grenada | 22.1 /100 | #204 | Fair 23.8% |
| Tongans | 20.8 /100 | #205 | Fair 23.8% |
| Immigrants | Jamaica | 20.7 /100 | #206 | Fair 23.8% |
| Immigrants | Sudan | 20.1 /100 | #207 | Fair 23.8% |
Demographics Similar to Immigrants from Peru by Disability Age 65 to 74
In terms of disability age 65 to 74, the demographic groups most similar to Immigrants from Peru are Serbian (22.3%, a difference of 0.020%), Albanian (22.3%, a difference of 0.050%), Immigrants from South America (22.3%, a difference of 0.080%), Syrian (22.3%, a difference of 0.13%), and Immigrants from Zimbabwe (22.3%, a difference of 0.14%).
| Demographics | Rating | Rank | Disability Age 65 to 74 |
| South Americans | 96.4 /100 | #103 | Exceptional 22.2% |
| Colombians | 96.4 /100 | #104 | Exceptional 22.2% |
| Palestinians | 96.3 /100 | #105 | Exceptional 22.2% |
| Peruvians | 96.1 /100 | #106 | Exceptional 22.2% |
| Slovenes | 96.1 /100 | #107 | Exceptional 22.2% |
| Immigrants | Zimbabwe | 96.1 /100 | #108 | Exceptional 22.3% |
| Albanians | 95.8 /100 | #109 | Exceptional 22.3% |
| Immigrants | Peru | 95.7 /100 | #110 | Exceptional 22.3% |
| Serbians | 95.7 /100 | #111 | Exceptional 22.3% |
| Immigrants | South America | 95.5 /100 | #112 | Exceptional 22.3% |
| Syrians | 95.3 /100 | #113 | Exceptional 22.3% |
| Ukrainians | 95.1 /100 | #114 | Exceptional 22.3% |
| Laotians | 94.9 /100 | #115 | Exceptional 22.3% |
| Brazilians | 94.8 /100 | #116 | Exceptional 22.4% |
| Swedes | 94.7 /100 | #117 | Exceptional 22.4% |