French American Indian vs Immigrants from Afghanistan Disability Age 18 to 34
COMPARE
French American Indian
Immigrants from Afghanistan
Disability Age 18 to 34
Disability Age 18 to 34 Comparison
French American Indians
Immigrants from Afghanistan
8.2%
DISABILITY AGE 18 TO 34
0.0/ 100
METRIC RATING
323rd/ 347
METRIC RANK
6.2%
DISABILITY AGE 18 TO 34
95.9/ 100
METRIC RATING
106th/ 347
METRIC RANK
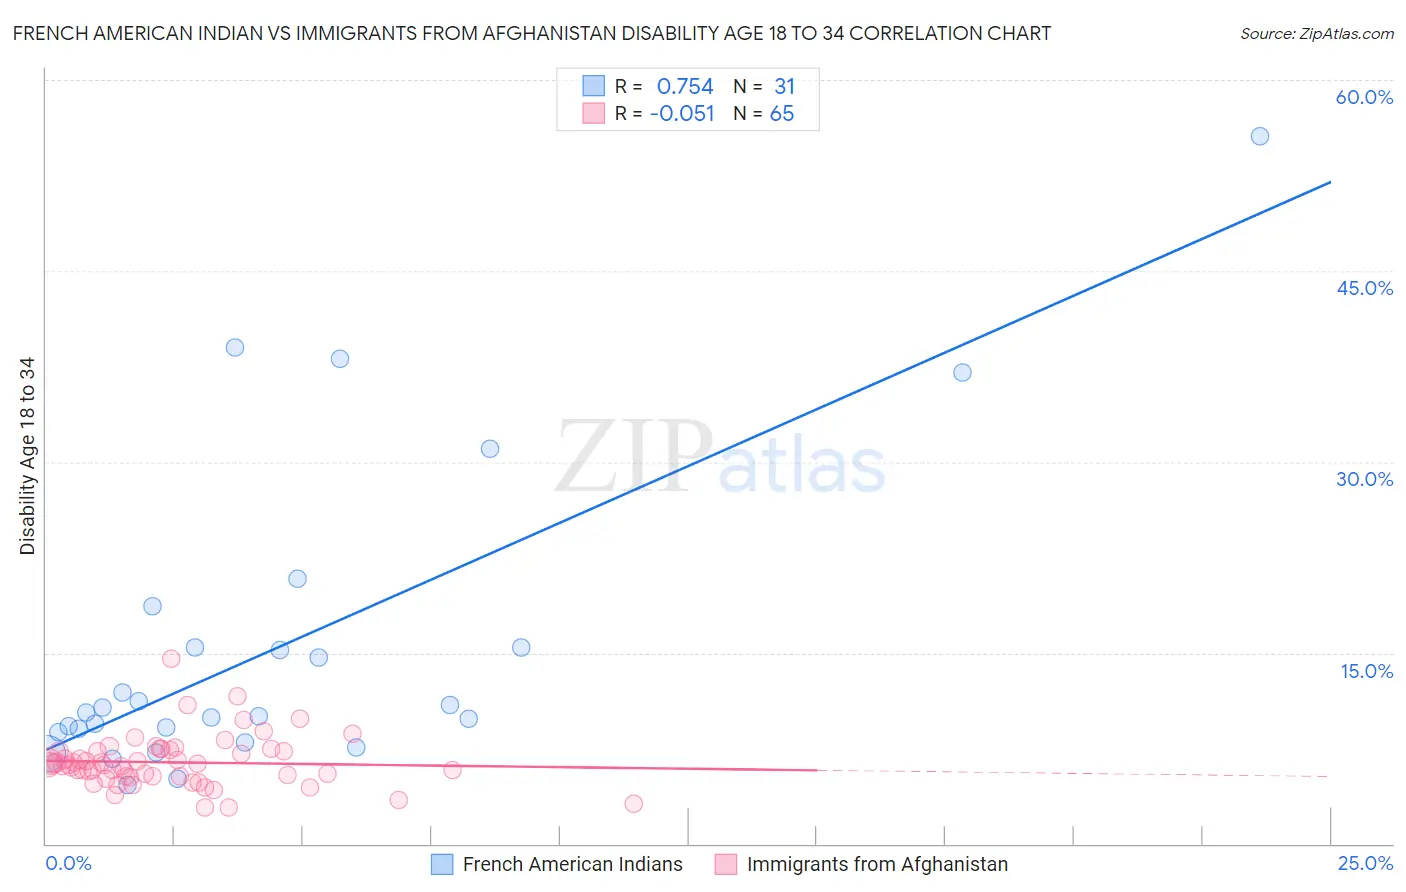
French American Indian vs Immigrants from Afghanistan Disability Age 18 to 34 Correlation Chart
The statistical analysis conducted on geographies consisting of 131,872,586 people shows a strong positive correlation between the proportion of French American Indians and percentage of population with a disability between the ages 18 and 35 in the United States with a correlation coefficient (R) of 0.754 and weighted average of 8.2%. Similarly, the statistical analysis conducted on geographies consisting of 147,569,267 people shows a slight negative correlation between the proportion of Immigrants from Afghanistan and percentage of population with a disability between the ages 18 and 35 in the United States with a correlation coefficient (R) of -0.051 and weighted average of 6.2%, a difference of 30.9%.
Disability Age 18 to 34 Correlation Summary
| Measurement | French American Indian | Immigrants from Afghanistan |
| Minimum | 4.6% | 2.8% |
| Maximum | 55.6% | 14.6% |
| Range | 50.9% | 11.8% |
| Mean | 15.4% | 6.4% |
| Median | 10.3% | 6.2% |
| Interquartile 25% (IQ1) | 8.8% | 5.3% |
| Interquartile 75% (IQ3) | 15.4% | 7.3% |
| Interquartile Range (IQR) | 6.6% | 2.1% |
| Standard Deviation (Sample) | 12.1% | 2.0% |
| Standard Deviation (Population) | 11.9% | 2.0% |
Similar Demographics by Disability Age 18 to 34
Demographics Similar to French American Indians by Disability Age 18 to 34
In terms of disability age 18 to 34, the demographic groups most similar to French American Indians are Cajun (8.2%, a difference of 0.040%), Cree (8.1%, a difference of 0.51%), Native/Alaskan (8.2%, a difference of 0.56%), Blackfeet (8.1%, a difference of 0.57%), and Potawatomi (8.2%, a difference of 0.58%).
| Demographics | Rating | Rank | Disability Age 18 to 34 |
| Puerto Ricans | 0.0 /100 | #316 | Tragic 8.0% |
| Hmong | 0.0 /100 | #317 | Tragic 8.1% |
| French Canadians | 0.0 /100 | #318 | Tragic 8.1% |
| Aleuts | 0.0 /100 | #319 | Tragic 8.1% |
| Navajo | 0.0 /100 | #320 | Tragic 8.1% |
| Blackfeet | 0.0 /100 | #321 | Tragic 8.1% |
| Cree | 0.0 /100 | #322 | Tragic 8.1% |
| French American Indians | 0.0 /100 | #323 | Tragic 8.2% |
| Cajuns | 0.0 /100 | #324 | Tragic 8.2% |
| Natives/Alaskans | 0.0 /100 | #325 | Tragic 8.2% |
| Potawatomi | 0.0 /100 | #326 | Tragic 8.2% |
| Sioux | 0.0 /100 | #327 | Tragic 8.2% |
| Delaware | 0.0 /100 | #328 | Tragic 8.2% |
| Crow | 0.0 /100 | #329 | Tragic 8.3% |
| Osage | 0.0 /100 | #330 | Tragic 8.3% |
Demographics Similar to Immigrants from Afghanistan by Disability Age 18 to 34
In terms of disability age 18 to 34, the demographic groups most similar to Immigrants from Afghanistan are Ethiopian (6.2%, a difference of 0.050%), Immigrants from Croatia (6.2%, a difference of 0.090%), Sri Lankan (6.2%, a difference of 0.14%), Mongolian (6.2%, a difference of 0.15%), and Bhutanese (6.2%, a difference of 0.15%).
| Demographics | Rating | Rank | Disability Age 18 to 34 |
| Immigrants | Ethiopia | 96.9 /100 | #99 | Exceptional 6.2% |
| Immigrants | Albania | 96.7 /100 | #100 | Exceptional 6.2% |
| Immigrants | Jamaica | 96.4 /100 | #101 | Exceptional 6.2% |
| Laotians | 96.4 /100 | #102 | Exceptional 6.2% |
| Immigrants | Bulgaria | 96.3 /100 | #103 | Exceptional 6.2% |
| Mongolians | 96.2 /100 | #104 | Exceptional 6.2% |
| Bhutanese | 96.2 /100 | #105 | Exceptional 6.2% |
| Immigrants | Afghanistan | 95.9 /100 | #106 | Exceptional 6.2% |
| Ethiopians | 95.8 /100 | #107 | Exceptional 6.2% |
| Immigrants | Croatia | 95.7 /100 | #108 | Exceptional 6.2% |
| Sri Lankans | 95.5 /100 | #109 | Exceptional 6.2% |
| Immigrants | Brazil | 95.2 /100 | #110 | Exceptional 6.3% |
| Immigrants | France | 95.1 /100 | #111 | Exceptional 6.3% |
| Immigrants | Romania | 94.9 /100 | #112 | Exceptional 6.3% |
| Immigrants | Latin America | 94.9 /100 | #113 | Exceptional 6.3% |