English vs Cypriot Disability Age 35 to 64
COMPARE
English
Cypriot
Disability Age 35 to 64
Disability Age 35 to 64 Comparison
English
Cypriots
12.4%
DISABILITY AGE 35 TO 64
0.6/ 100
METRIC RATING
259th/ 347
METRIC RANK
9.4%
DISABILITY AGE 35 TO 64
100.0/ 100
METRIC RATING
22nd/ 347
METRIC RANK
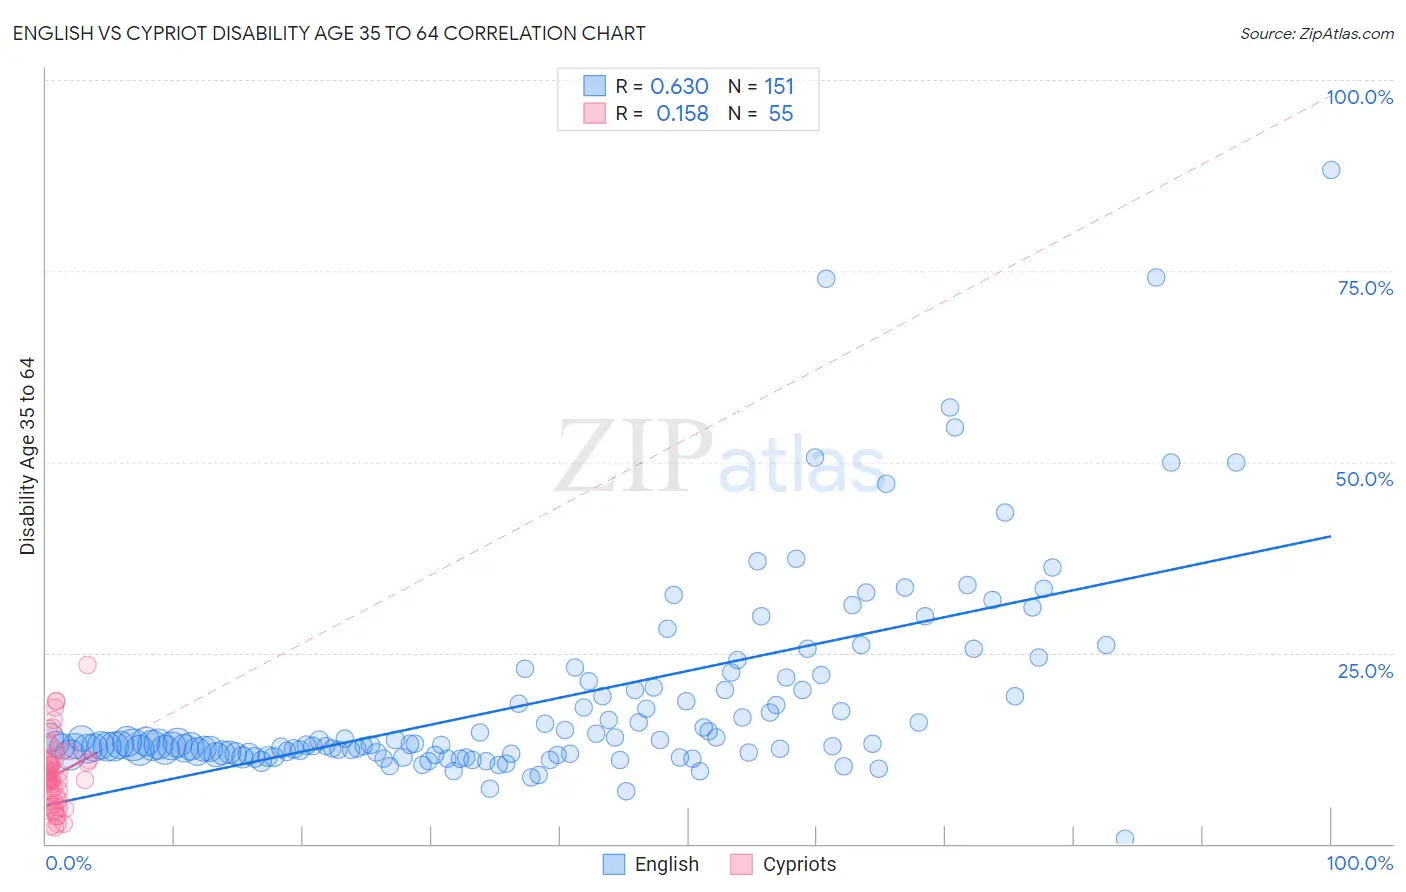
English vs Cypriot Disability Age 35 to 64 Correlation Chart
The statistical analysis conducted on geographies consisting of 578,471,169 people shows a significant positive correlation between the proportion of English and percentage of population with a disability between the ages 34 and 64 in the United States with a correlation coefficient (R) of 0.630 and weighted average of 12.4%. Similarly, the statistical analysis conducted on geographies consisting of 61,853,670 people shows a poor positive correlation between the proportion of Cypriots and percentage of population with a disability between the ages 34 and 64 in the United States with a correlation coefficient (R) of 0.158 and weighted average of 9.4%, a difference of 32.7%.
Disability Age 35 to 64 Correlation Summary
| Measurement | English | Cypriot |
| Minimum | 0.65% | 2.1% |
| Maximum | 88.2% | 23.4% |
| Range | 87.6% | 21.3% |
| Mean | 18.7% | 9.0% |
| Median | 12.9% | 8.5% |
| Interquartile 25% (IQ1) | 11.8% | 5.7% |
| Interquartile 75% (IQ3) | 20.2% | 10.9% |
| Interquartile Range (IQR) | 8.4% | 5.1% |
| Standard Deviation (Sample) | 13.2% | 4.5% |
| Standard Deviation (Population) | 13.1% | 4.4% |
Similar Demographics by Disability Age 35 to 64
Demographics Similar to English by Disability Age 35 to 64
In terms of disability age 35 to 64, the demographic groups most similar to English are Welsh (12.4%, a difference of 0.12%), Mexican (12.4%, a difference of 0.20%), German Russian (12.5%, a difference of 0.25%), Malaysian (12.5%, a difference of 0.40%), and Scottish (12.4%, a difference of 0.46%).
| Demographics | Rating | Rank | Disability Age 35 to 64 |
| Irish | 1.0 /100 | #252 | Tragic 12.3% |
| Dutch | 1.0 /100 | #253 | Tragic 12.3% |
| Hawaiians | 0.9 /100 | #254 | Tragic 12.3% |
| Japanese | 0.8 /100 | #255 | Tragic 12.3% |
| Scottish | 0.8 /100 | #256 | Tragic 12.4% |
| Mexicans | 0.7 /100 | #257 | Tragic 12.4% |
| Welsh | 0.6 /100 | #258 | Tragic 12.4% |
| English | 0.6 /100 | #259 | Tragic 12.4% |
| German Russians | 0.5 /100 | #260 | Tragic 12.5% |
| Malaysians | 0.5 /100 | #261 | Tragic 12.5% |
| Senegalese | 0.5 /100 | #262 | Tragic 12.5% |
| Immigrants | Zaire | 0.4 /100 | #263 | Tragic 12.5% |
| Immigrants | Portugal | 0.4 /100 | #264 | Tragic 12.5% |
| Marshallese | 0.4 /100 | #265 | Tragic 12.5% |
| Whites/Caucasians | 0.3 /100 | #266 | Tragic 12.6% |
Demographics Similar to Cypriots by Disability Age 35 to 64
In terms of disability age 35 to 64, the demographic groups most similar to Cypriots are Okinawan (9.4%, a difference of 0.030%), Argentinean (9.4%, a difference of 0.22%), Asian (9.4%, a difference of 0.23%), Immigrants from Argentina (9.3%, a difference of 0.46%), and Venezuelan (9.4%, a difference of 0.52%).
| Demographics | Rating | Rank | Disability Age 35 to 64 |
| Bolivians | 100.0 /100 | #15 | Exceptional 8.9% |
| Immigrants | Korea | 100.0 /100 | #16 | Exceptional 9.0% |
| Burmese | 100.0 /100 | #17 | Exceptional 9.2% |
| Soviet Union | 100.0 /100 | #18 | Exceptional 9.2% |
| Immigrants | Venezuela | 100.0 /100 | #19 | Exceptional 9.3% |
| Immigrants | Argentina | 100.0 /100 | #20 | Exceptional 9.3% |
| Okinawans | 100.0 /100 | #21 | Exceptional 9.4% |
| Cypriots | 100.0 /100 | #22 | Exceptional 9.4% |
| Argentineans | 100.0 /100 | #23 | Exceptional 9.4% |
| Asians | 100.0 /100 | #24 | Exceptional 9.4% |
| Venezuelans | 100.0 /100 | #25 | Exceptional 9.4% |
| Immigrants | Sri Lanka | 100.0 /100 | #26 | Exceptional 9.5% |
| Immigrants | Asia | 100.0 /100 | #27 | Exceptional 9.5% |
| Immigrants | Pakistan | 100.0 /100 | #28 | Exceptional 9.5% |
| Immigrants | Ireland | 100.0 /100 | #29 | Exceptional 9.5% |