Eastern European vs Okinawan Disability Age 65 to 74
COMPARE
Eastern European
Okinawan
Disability Age 65 to 74
Disability Age 65 to 74 Comparison
Eastern Europeans
Okinawans
20.6%
DISABILITY AGE 65 TO 74
100.0/ 100
METRIC RATING
18th/ 347
METRIC RANK
20.7%
DISABILITY AGE 65 TO 74
100.0/ 100
METRIC RATING
20th/ 347
METRIC RANK
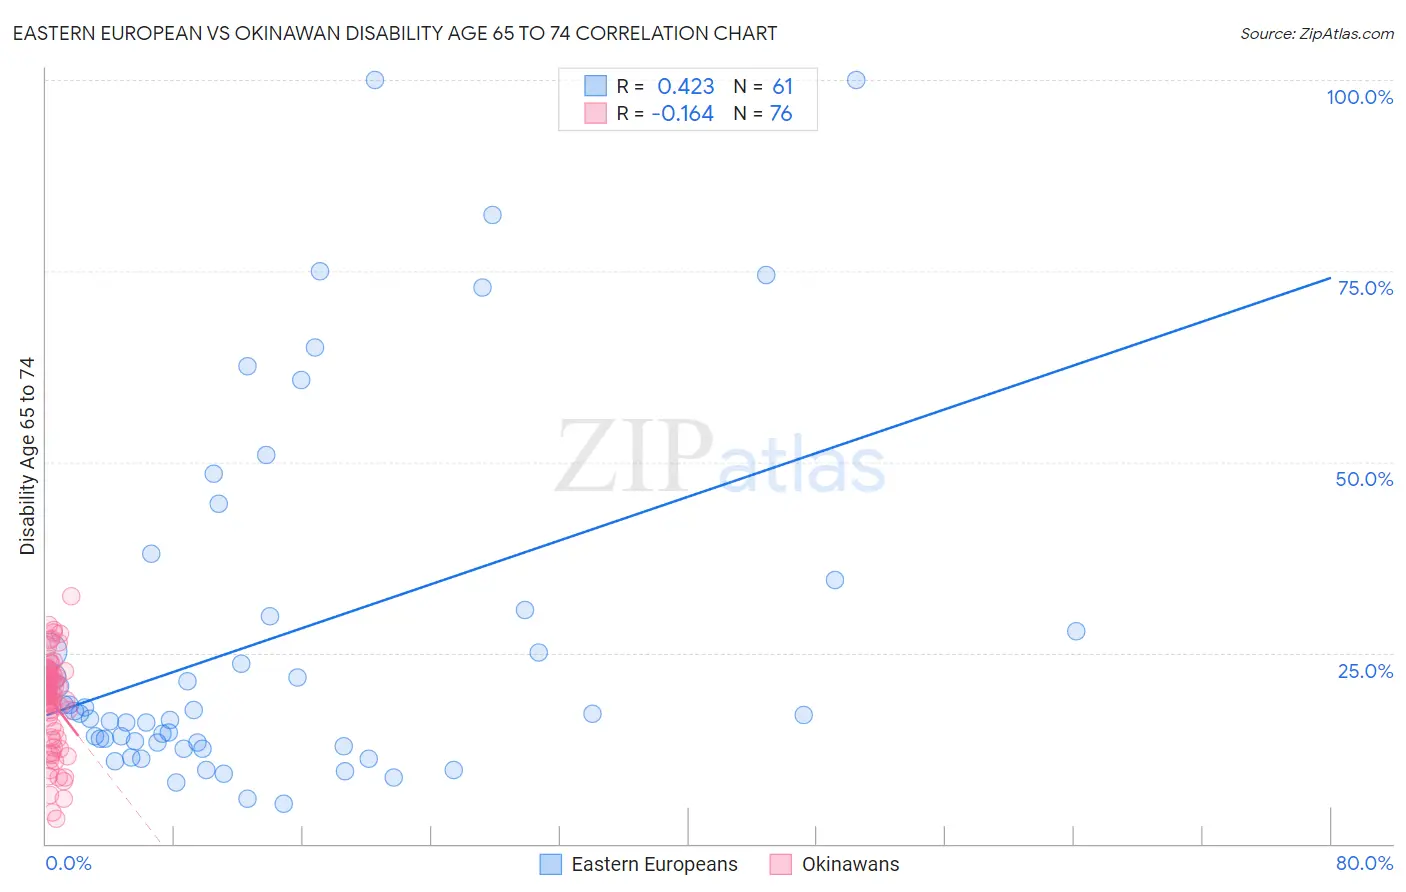
Eastern European vs Okinawan Disability Age 65 to 74 Correlation Chart
The statistical analysis conducted on geographies consisting of 460,228,956 people shows a moderate positive correlation between the proportion of Eastern Europeans and percentage of population with a disability between the ages 65 and 75 in the United States with a correlation coefficient (R) of 0.423 and weighted average of 20.6%. Similarly, the statistical analysis conducted on geographies consisting of 73,634,588 people shows a poor negative correlation between the proportion of Okinawans and percentage of population with a disability between the ages 65 and 75 in the United States with a correlation coefficient (R) of -0.164 and weighted average of 20.7%, a difference of 0.35%.
Disability Age 65 to 74 Correlation Summary
| Measurement | Eastern European | Okinawan |
| Minimum | 5.2% | 3.2% |
| Maximum | 100.0% | 32.4% |
| Range | 94.8% | 29.1% |
| Mean | 27.0% | 18.4% |
| Median | 17.0% | 19.5% |
| Interquartile 25% (IQ1) | 13.0% | 13.8% |
| Interquartile 75% (IQ3) | 30.2% | 22.7% |
| Interquartile Range (IQR) | 17.2% | 8.8% |
| Standard Deviation (Sample) | 23.5% | 6.2% |
| Standard Deviation (Population) | 23.4% | 6.1% |
Demographics Similar to Eastern Europeans and Okinawans by Disability Age 65 to 74
In terms of disability age 65 to 74, the demographic groups most similar to Eastern Europeans are Burmese (20.6%, a difference of 0.030%), Immigrants from South Central Asia (20.6%, a difference of 0.070%), Immigrants from Lithuania (20.5%, a difference of 0.32%), Paraguayan (20.5%, a difference of 0.38%), and Indian (Asian) (20.5%, a difference of 0.40%). Similarly, the demographic groups most similar to Okinawans are Burmese (20.6%, a difference of 0.32%), Immigrants from South Central Asia (20.6%, a difference of 0.42%), Immigrants from Lithuania (20.5%, a difference of 0.67%), Paraguayan (20.5%, a difference of 0.73%), and Immigrants from Bolivia (20.8%, a difference of 0.74%).
| Demographics | Rating | Rank | Disability Age 65 to 74 |
| Immigrants | China | 100.0 /100 | #9 | Exceptional 20.3% |
| Immigrants | Eastern Asia | 100.0 /100 | #10 | Exceptional 20.3% |
| Immigrants | Ireland | 100.0 /100 | #11 | Exceptional 20.3% |
| Immigrants | Korea | 100.0 /100 | #12 | Exceptional 20.4% |
| Immigrants | Singapore | 100.0 /100 | #13 | Exceptional 20.4% |
| Indians (Asian) | 100.0 /100 | #14 | Exceptional 20.5% |
| Paraguayans | 100.0 /100 | #15 | Exceptional 20.5% |
| Immigrants | Lithuania | 100.0 /100 | #16 | Exceptional 20.5% |
| Immigrants | South Central Asia | 100.0 /100 | #17 | Exceptional 20.6% |
| Eastern Europeans | 100.0 /100 | #18 | Exceptional 20.6% |
| Burmese | 100.0 /100 | #19 | Exceptional 20.6% |
| Okinawans | 100.0 /100 | #20 | Exceptional 20.7% |
| Immigrants | Bolivia | 99.9 /100 | #21 | Exceptional 20.8% |
| Immigrants | Iran | 99.9 /100 | #22 | Exceptional 20.9% |
| Immigrants | Belgium | 99.9 /100 | #23 | Exceptional 21.0% |
| Soviet Union | 99.9 /100 | #24 | Exceptional 21.0% |
| Bolivians | 99.9 /100 | #25 | Exceptional 21.0% |
| Immigrants | Australia | 99.9 /100 | #26 | Exceptional 21.0% |
| Immigrants | Sweden | 99.9 /100 | #27 | Exceptional 21.0% |
| Immigrants | Czechoslovakia | 99.9 /100 | #28 | Exceptional 21.0% |
| Immigrants | Japan | 99.9 /100 | #29 | Exceptional 21.0% |