Dutch West Indian vs Italian Disability Age 18 to 34
COMPARE
Dutch West Indian
Italian
Disability Age 18 to 34
Disability Age 18 to 34 Comparison
Dutch West Indians
Italians
8.4%
DISABILITY AGE 18 TO 34
0.0/ 100
METRIC RATING
334th/ 347
METRIC RANK
7.1%
DISABILITY AGE 18 TO 34
1.2/ 100
METRIC RATING
239th/ 347
METRIC RANK
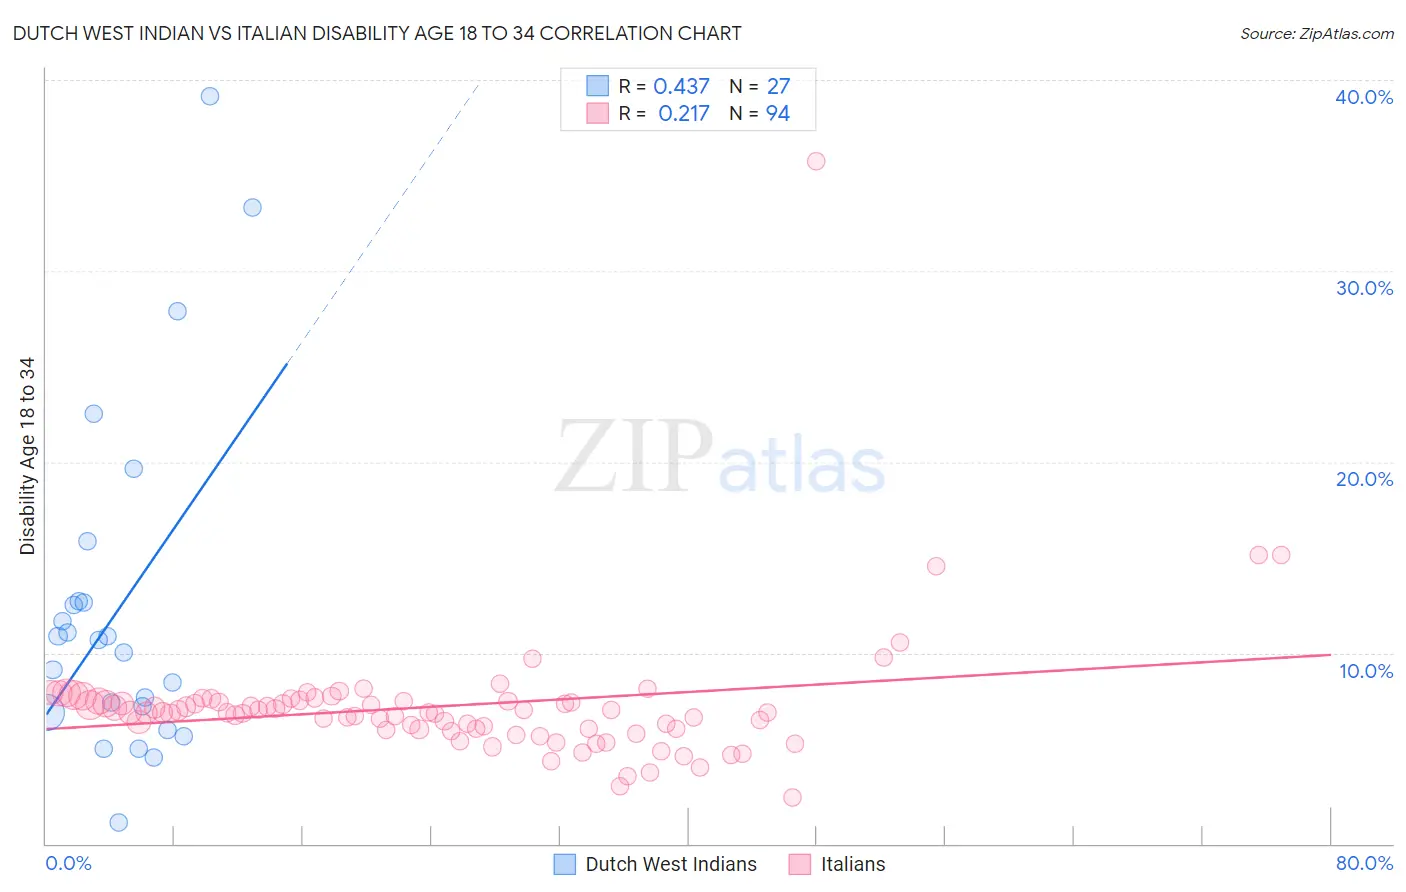
Dutch West Indian vs Italian Disability Age 18 to 34 Correlation Chart
The statistical analysis conducted on geographies consisting of 85,713,308 people shows a moderate positive correlation between the proportion of Dutch West Indians and percentage of population with a disability between the ages 18 and 35 in the United States with a correlation coefficient (R) of 0.437 and weighted average of 8.4%. Similarly, the statistical analysis conducted on geographies consisting of 568,731,898 people shows a weak positive correlation between the proportion of Italians and percentage of population with a disability between the ages 18 and 35 in the United States with a correlation coefficient (R) of 0.217 and weighted average of 7.1%, a difference of 18.7%.
Disability Age 18 to 34 Correlation Summary
| Measurement | Dutch West Indian | Italian |
| Minimum | 1.1% | 2.5% |
| Maximum | 39.1% | 35.7% |
| Range | 38.0% | 33.3% |
| Mean | 12.4% | 7.2% |
| Median | 10.7% | 6.9% |
| Interquartile 25% (IQ1) | 6.9% | 6.0% |
| Interquartile 75% (IQ3) | 12.7% | 7.5% |
| Interquartile Range (IQR) | 5.8% | 1.5% |
| Standard Deviation (Sample) | 9.0% | 3.6% |
| Standard Deviation (Population) | 8.8% | 3.6% |
Similar Demographics by Disability Age 18 to 34
Demographics Similar to Dutch West Indians by Disability Age 18 to 34
In terms of disability age 18 to 34, the demographic groups most similar to Dutch West Indians are Seminole (8.4%, a difference of 0.11%), Apache (8.4%, a difference of 0.21%), Puget Sound Salish (8.3%, a difference of 1.3%), Immigrants from the Azores (8.5%, a difference of 1.3%), and Comanche (8.3%, a difference of 1.5%).
| Demographics | Rating | Rank | Disability Age 18 to 34 |
| Sioux | 0.0 /100 | #327 | Tragic 8.2% |
| Delaware | 0.0 /100 | #328 | Tragic 8.2% |
| Crow | 0.0 /100 | #329 | Tragic 8.3% |
| Osage | 0.0 /100 | #330 | Tragic 8.3% |
| Comanche | 0.0 /100 | #331 | Tragic 8.3% |
| Puget Sound Salish | 0.0 /100 | #332 | Tragic 8.3% |
| Apache | 0.0 /100 | #333 | Tragic 8.4% |
| Dutch West Indians | 0.0 /100 | #334 | Tragic 8.4% |
| Seminole | 0.0 /100 | #335 | Tragic 8.4% |
| Immigrants | Azores | 0.0 /100 | #336 | Tragic 8.5% |
| Ottawa | 0.0 /100 | #337 | Tragic 8.6% |
| Cherokee | 0.0 /100 | #338 | Tragic 8.7% |
| Kiowa | 0.0 /100 | #339 | Tragic 8.8% |
| Choctaw | 0.0 /100 | #340 | Tragic 9.0% |
| Chickasaw | 0.0 /100 | #341 | Tragic 9.0% |
Demographics Similar to Italians by Disability Age 18 to 34
In terms of disability age 18 to 34, the demographic groups most similar to Italians are Marshallese (7.1%, a difference of 0.12%), Arapaho (7.1%, a difference of 0.12%), Nepalese (7.1%, a difference of 0.12%), Austrian (7.1%, a difference of 0.16%), and Immigrants from Congo (7.1%, a difference of 0.16%).
| Demographics | Rating | Rank | Disability Age 18 to 34 |
| Samoans | 3.2 /100 | #232 | Tragic 7.0% |
| New Zealanders | 2.7 /100 | #233 | Tragic 7.0% |
| Alsatians | 2.1 /100 | #234 | Tragic 7.0% |
| Sub-Saharan Africans | 1.7 /100 | #235 | Tragic 7.1% |
| Liberians | 1.5 /100 | #236 | Tragic 7.1% |
| Austrians | 1.3 /100 | #237 | Tragic 7.1% |
| Marshallese | 1.3 /100 | #238 | Tragic 7.1% |
| Italians | 1.2 /100 | #239 | Tragic 7.1% |
| Arapaho | 1.1 /100 | #240 | Tragic 7.1% |
| Nepalese | 1.1 /100 | #241 | Tragic 7.1% |
| Immigrants | Congo | 1.1 /100 | #242 | Tragic 7.1% |
| Icelanders | 1.0 /100 | #243 | Tragic 7.1% |
| Immigrants | Zaire | 0.9 /100 | #244 | Tragic 7.1% |
| Hungarians | 0.9 /100 | #245 | Tragic 7.1% |
| Immigrants | Liberia | 0.8 /100 | #246 | Tragic 7.1% |