Dutch vs Eastern European Ambulatory Disability
COMPARE
Dutch
Eastern European
Ambulatory Disability
Ambulatory Disability Comparison
Dutch
Eastern Europeans
6.4%
AMBULATORY DISABILITY
2.0/ 100
METRIC RATING
236th/ 347
METRIC RANK
5.7%
AMBULATORY DISABILITY
99.2/ 100
METRIC RATING
83rd/ 347
METRIC RANK
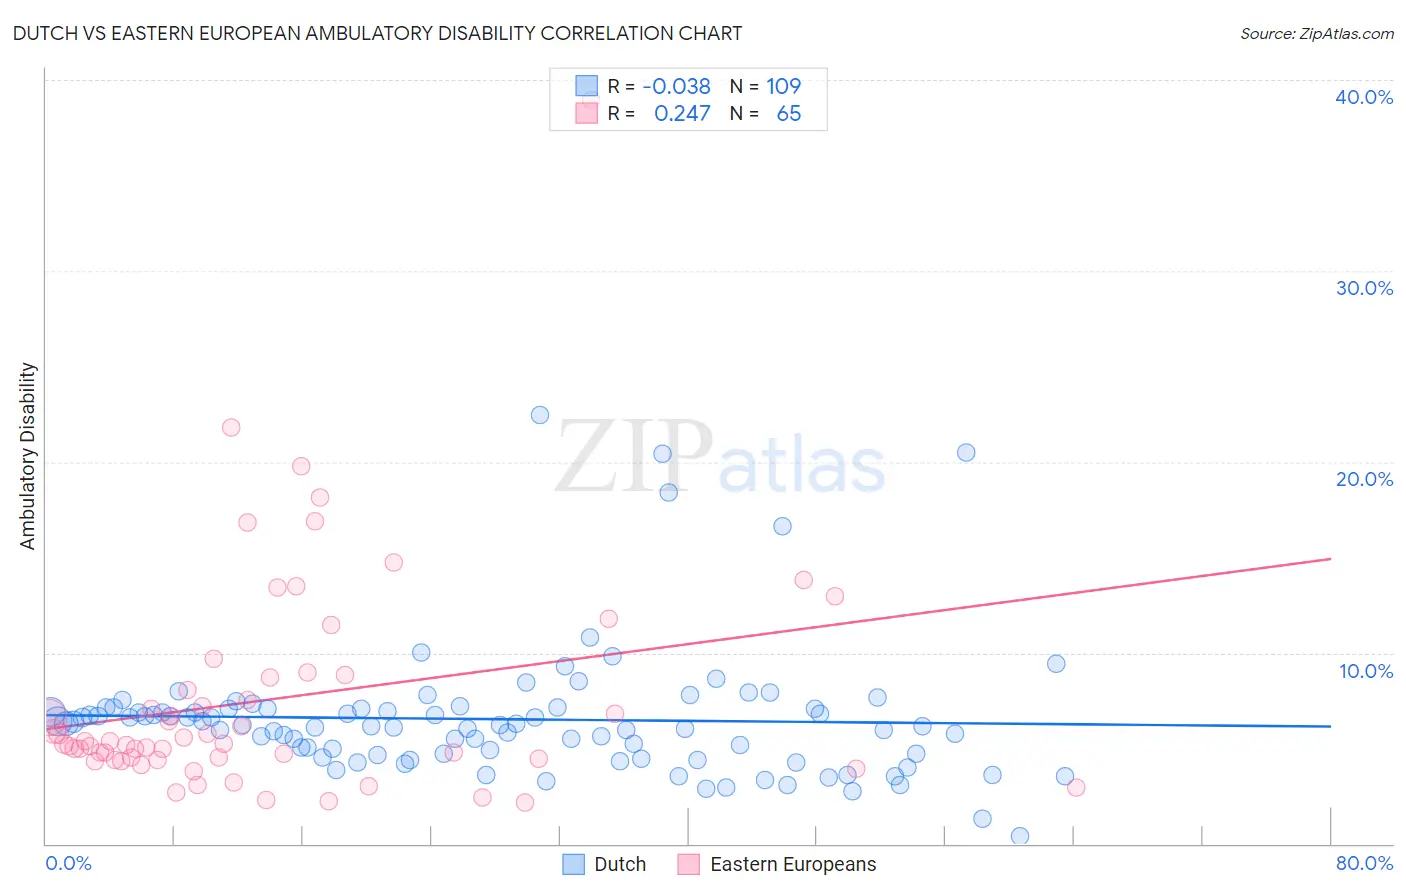
Dutch vs Eastern European Ambulatory Disability Correlation Chart
The statistical analysis conducted on geographies consisting of 553,973,696 people shows no correlation between the proportion of Dutch and percentage of population with ambulatory disability in the United States with a correlation coefficient (R) of -0.038 and weighted average of 6.4%. Similarly, the statistical analysis conducted on geographies consisting of 461,048,230 people shows a weak positive correlation between the proportion of Eastern Europeans and percentage of population with ambulatory disability in the United States with a correlation coefficient (R) of 0.247 and weighted average of 5.7%, a difference of 12.3%.
Ambulatory Disability Correlation Summary
| Measurement | Dutch | Eastern European |
| Minimum | 0.40% | 2.2% |
| Maximum | 22.4% | 39.0% |
| Range | 22.0% | 36.8% |
| Mean | 6.5% | 7.6% |
| Median | 6.2% | 5.3% |
| Interquartile 25% (IQ1) | 4.7% | 4.4% |
| Interquartile 75% (IQ3) | 7.1% | 8.8% |
| Interquartile Range (IQR) | 2.4% | 4.4% |
| Standard Deviation (Sample) | 3.4% | 6.0% |
| Standard Deviation (Population) | 3.4% | 5.9% |
Similar Demographics by Ambulatory Disability
Demographics Similar to Dutch by Ambulatory Disability
In terms of ambulatory disability, the demographic groups most similar to Dutch are Immigrants from Germany (6.4%, a difference of 0.090%), Haitian (6.4%, a difference of 0.10%), Hispanic or Latino (6.4%, a difference of 0.15%), Senegalese (6.4%, a difference of 0.16%), and Immigrants from Liberia (6.4%, a difference of 0.18%).
| Demographics | Rating | Rank | Ambulatory Disability |
| Czechoslovakians | 3.8 /100 | #229 | Tragic 6.4% |
| Mexicans | 3.5 /100 | #230 | Tragic 6.4% |
| Panamanians | 3.1 /100 | #231 | Tragic 6.4% |
| Assyrians/Chaldeans/Syriacs | 2.4 /100 | #232 | Tragic 6.4% |
| Sub-Saharan Africans | 2.3 /100 | #233 | Tragic 6.4% |
| Immigrants | Liberia | 2.3 /100 | #234 | Tragic 6.4% |
| Hispanics or Latinos | 2.2 /100 | #235 | Tragic 6.4% |
| Dutch | 2.0 /100 | #236 | Tragic 6.4% |
| Immigrants | Germany | 1.8 /100 | #237 | Tragic 6.4% |
| Haitians | 1.8 /100 | #238 | Tragic 6.4% |
| Senegalese | 1.7 /100 | #239 | Tragic 6.4% |
| Immigrants | Senegal | 1.7 /100 | #240 | Tragic 6.4% |
| Immigrants | Haiti | 1.6 /100 | #241 | Tragic 6.5% |
| Spaniards | 1.6 /100 | #242 | Tragic 6.5% |
| Germans | 1.5 /100 | #243 | Tragic 6.5% |
Demographics Similar to Eastern Europeans by Ambulatory Disability
In terms of ambulatory disability, the demographic groups most similar to Eastern Europeans are Ugandan (5.7%, a difference of 0.0%), Immigrants from Jordan (5.7%, a difference of 0.020%), Palestinian (5.7%, a difference of 0.020%), Immigrants from Ireland (5.7%, a difference of 0.030%), and Chilean (5.7%, a difference of 0.16%).
| Demographics | Rating | Rank | Ambulatory Disability |
| Sudanese | 99.3 /100 | #76 | Exceptional 5.7% |
| Immigrants | Vietnam | 99.3 /100 | #77 | Exceptional 5.7% |
| Somalis | 99.2 /100 | #78 | Exceptional 5.7% |
| Chileans | 99.2 /100 | #79 | Exceptional 5.7% |
| Immigrants | Ireland | 99.2 /100 | #80 | Exceptional 5.7% |
| Immigrants | Jordan | 99.2 /100 | #81 | Exceptional 5.7% |
| Palestinians | 99.2 /100 | #82 | Exceptional 5.7% |
| Eastern Europeans | 99.2 /100 | #83 | Exceptional 5.7% |
| Ugandans | 99.2 /100 | #84 | Exceptional 5.7% |
| South Americans | 99.0 /100 | #85 | Exceptional 5.7% |
| Latvians | 99.0 /100 | #86 | Exceptional 5.7% |
| Immigrants | Chile | 98.9 /100 | #87 | Exceptional 5.8% |
| Soviet Union | 98.9 /100 | #88 | Exceptional 5.8% |
| Bhutanese | 98.8 /100 | #89 | Exceptional 5.8% |
| Australians | 98.8 /100 | #90 | Exceptional 5.8% |