Czechoslovakian vs Immigrants from Czechoslovakia Disability Age 35 to 64

COMPARE

Czechoslovakian
Race
Ancestry
AfghanAfricanAlaska NativeAlaskan AthabascanAlbanianAleutAlsatianAmericanApacheArabArapahoArgentineanArmenianAssyrian/Chaldean/SyriacAustralianAustrianBahamianBangladeshiBarbadianBasqueBelgianBelizeanBermudanBhutaneseBlackfeetBolivianBrazilianBritishBritish West IndianBulgarianBurmeseCajunCambodianCanadianCape VerdeanCarpatho RusynCelticCentral AmericanCentral American IndianCherokeeCheyenneChickasawChileanChineseChippewaChoctawColombianColvilleComancheCosta RicanCreeCreekCroatianCrowCubanCypriotCzechCzechoslovakianDanishDelawareDominicanDutchDutch West IndianEastern EuropeanEcuadorianEgyptianEnglishEstonianEthiopianEuropeanFijianFilipinoFinnishFrenchFrench American IndianFrench CanadianGermanGerman RussianGhanaianGreekGuamanian/ChamorroGuatemalanGuyaneseHaitianHmongHonduranHopiHoumaHungarianIcelanderIndian (Asian)IndonesianInupiatIranianIraqiIrishIroquoisIsraeliItalianJamaicanJapaneseJordanianKenyanKiowaKoreanLaotianLatvianLebaneseLiberianLithuanianLumbeeLuxembourgerMacedonianMalaysianMalteseMarshalleseMenomineeMexicanMexican American IndianMongolianMoroccanNative HawaiianNavajoNepaleseNew ZealanderNicaraguanNigerianNorthern EuropeanNorwegianOkinawanOsageOttawaPaiutePakistaniPalestinianPanamanianParaguayanPennsylvania GermanPeruvianPimaPolishPortuguesePotawatomiPuebloPuerto RicanPuget Sound SalishRomanianRussianSalvadoranSamoanScandinavianScotch-IrishScottishSeminoleSenegaleseSerbianShoshoneSierra LeoneanSiouxSlavicSlovakSloveneSomaliSouth AfricanSouth AmericanSouth American IndianSoviet UnionSpaniardSpanishSpanish AmericanSpanish American IndianSri LankanSubsaharan AfricanSudaneseSwedishSwissSyrianTaiwaneseThaiTlingit-HaidaTohono O'OdhamTonganTrinidadian and TobagonianTsimshianTurkishU.S. Virgin IslanderUgandanUkrainianUruguayanUteVenezuelanVietnameseWelshWest IndianYakamaYaquiYugoslavianYumanYup'ikZimbabwean
Immigration
NonimmigrantsImmigrantsAfghanistanAfricaAlbaniaArgentinaArmeniaAsiaAustraliaAustriaBahamasBangladeshBarbadosBelarusBelgiumBelizeBoliviaBosnia and HerzegovinaBrazilBulgariaBurma/MyanmarCabo VerdeCambodiaCameroonCanadaCaribbeanCentral AmericaChileChinaColombiaCongoCosta RicaCroatiaCubaDenmarkDominicaDominican RepublicEastern AfricaEastern AsiaEastern EuropeEcuadorEgyptEl SalvadorEnglandEritreaEthiopiaEuropeFijiFranceGermanyGhanaGreeceGrenadaGuatemalaGuyanaHaitiHondurasHong KongHungaryIndiaIndonesiaIranIraqIrelandIsraelItalyJamaicaJapanJordanKazakhstanKenyaKoreaKuwaitLaosLatin AmericaLatviaLebanonLiberiaLithuaniaMalaysiaMexicoMicronesiaMiddle AfricaMoldovaMoroccoNepalNetherlandsNicaraguaNigeriaNorth AmericaNorth MacedoniaNorthern AfricaNorthern EuropeNorwayOceaniaPakistanPanamaPeruPhilippinesPolandPortugalRomaniaRussiaSaudi ArabiaScotlandSenegalSerbiaSierra LeoneSingaporeSomaliaSouth AfricaSouth AmericaSouth Central AsiaSouth Eastern AsiaSouthern EuropeSpainSri LankaSt. Vincent and the GrenadinesSudanSwedenSwitzerlandSyriaTaiwanThailandTrinidad and TobagoTurkeyUgandaUkraineUruguayUzbekistanVenezuelaVietnamWest IndiesWestern AfricaWestern AsiaWestern EuropeYemenZaireZimbabweAzores
Immigrants from Czechoslovakia
Race
Ancestry
AfghanAfricanAlaska NativeAlaskan AthabascanAlbanianAleutAlsatianAmericanApacheArabArapahoArgentineanArmenianAssyrian/Chaldean/SyriacAustralianAustrianBahamianBangladeshiBarbadianBasqueBelgianBelizeanBermudanBhutaneseBlackfeetBolivianBrazilianBritishBritish West IndianBulgarianBurmeseCajunCambodianCanadianCape VerdeanCarpatho RusynCelticCentral AmericanCentral American IndianCherokeeCheyenneChickasawChileanChineseChippewaChoctawColombianColvilleComancheCosta RicanCreeCreekCroatianCrowCubanCypriotCzechDanishDelawareDominicanDutchDutch West IndianEastern EuropeanEcuadorianEgyptianEnglishEstonianEthiopianEuropeanFijianFilipinoFinnishFrenchFrench American IndianFrench CanadianGermanGerman RussianGhanaianGreekGuamanian/ChamorroGuatemalanGuyaneseHaitianHmongHonduranHopiHoumaHungarianIcelanderIndian (Asian)IndonesianInupiatIranianIraqiIrishIroquoisIsraeliItalianJamaicanJapaneseJordanianKenyanKiowaKoreanLaotianLatvianLebaneseLiberianLithuanianLumbeeLuxembourgerMacedonianMalaysianMalteseMarshalleseMenomineeMexicanMexican American IndianMongolianMoroccanNative HawaiianNavajoNepaleseNew ZealanderNicaraguanNigerianNorthern EuropeanNorwegianOkinawanOsageOttawaPaiutePakistaniPalestinianPanamanianParaguayanPennsylvania GermanPeruvianPimaPolishPortuguesePotawatomiPuebloPuerto RicanPuget Sound SalishRomanianRussianSalvadoranSamoanScandinavianScotch-IrishScottishSeminoleSenegaleseSerbianShoshoneSierra LeoneanSiouxSlavicSlovakSloveneSomaliSouth AfricanSouth AmericanSouth American IndianSoviet UnionSpaniardSpanishSpanish AmericanSpanish American IndianSri LankanSubsaharan AfricanSudaneseSwedishSwissSyrianTaiwaneseThaiTlingit-HaidaTohono O'OdhamTonganTrinidadian and TobagonianTsimshianTurkishU.S. Virgin IslanderUgandanUkrainianUruguayanUteVenezuelanVietnameseWelshWest IndianYakamaYaquiYugoslavianYumanYup'ikZimbabwean
Immigration
NonimmigrantsImmigrantsAfghanistanAfricaAlbaniaArgentinaArmeniaAsiaAustraliaAustriaBahamasBangladeshBarbadosBelarusBelgiumBelizeBoliviaBosnia and HerzegovinaBrazilBulgariaBurma/MyanmarCabo VerdeCambodiaCameroonCanadaCaribbeanCentral AmericaChileChinaColombiaCongoCosta RicaCroatiaCubaCzechoslovakiaDenmarkDominicaDominican RepublicEastern AfricaEastern AsiaEastern EuropeEcuadorEgyptEl SalvadorEnglandEritreaEthiopiaEuropeFijiFranceGermanyGhanaGreeceGrenadaGuatemalaGuyanaHaitiHondurasHong KongHungaryIndiaIndonesiaIranIraqIrelandIsraelItalyJamaicaJapanJordanKazakhstanKenyaKoreaKuwaitLaosLatin AmericaLatviaLebanonLiberiaLithuaniaMalaysiaMexicoMicronesiaMiddle AfricaMoldovaMoroccoNepalNetherlandsNicaraguaNigeriaNorth AmericaNorth MacedoniaNorthern AfricaNorthern EuropeNorwayOceaniaPakistanPanamaPeruPhilippinesPolandPortugalRomaniaRussiaSaudi ArabiaScotlandSenegalSerbiaSierra LeoneSingaporeSomaliaSouth AfricaSouth AmericaSouth Central AsiaSouth Eastern AsiaSouthern EuropeSpainSri LankaSt. Vincent and the GrenadinesSudanSwedenSwitzerlandSyriaTaiwanThailandTrinidad and TobagoTurkeyUgandaUkraineUruguayUzbekistanVenezuelaVietnamWest IndiesWestern AfricaWestern AsiaWestern EuropeYemenZaireZimbabweAzores
Disability Age 35 to 64
Income
Poverty
Unemployment
Labor Participation
Family Structure
Vehicle Availability
Education Level
Disability

Disability Age 35 to 64 Comparison

Czechoslovakians

Immigrants from Czechoslovakia

Tragic
Exceptional
11.8%
DISABILITY AGE 35 TO 64
9.0/ 100
METRIC RATING
219th/ 347
METRIC RANK
10.0%
DISABILITY AGE 35 TO 64
99.7/ 100
METRIC RATING
63rd/ 347
METRIC RANK

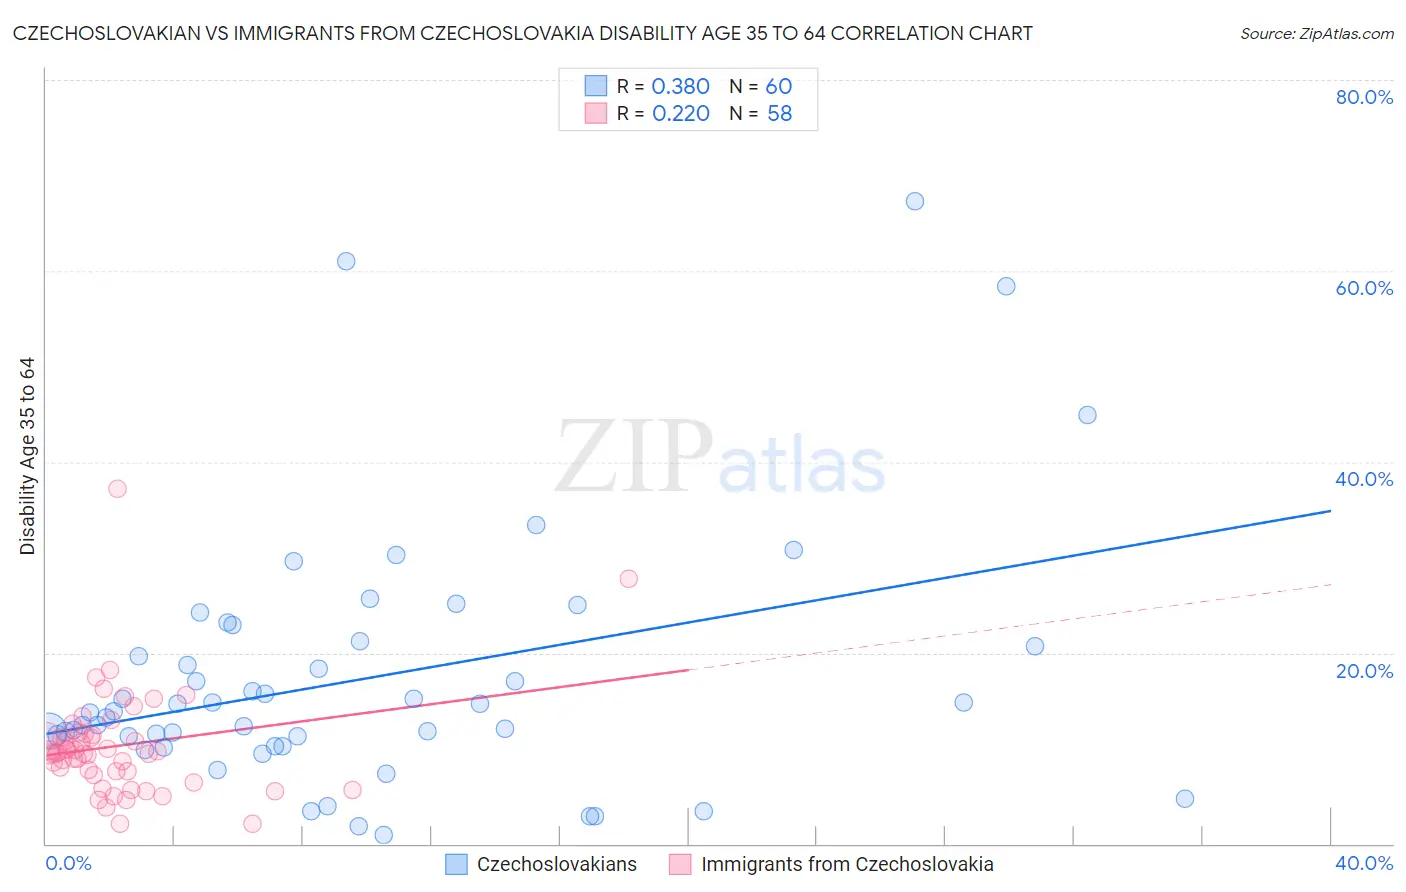
Czechoslovakian vs Immigrants from Czechoslovakia Disability Age 35 to 64 Correlation Chart

The statistical analysis conducted on geographies consisting of 368,507,713 people shows a mild positive correlation between the proportion of Czechoslovakians and percentage of population with a disability between the ages 34 and 64 in the United States with a correlation coefficient (R) of 0.380 and weighted average of 11.8%. Similarly, the statistical analysis conducted on geographies consisting of 195,428,118 people shows a weak positive correlation between the proportion of Immigrants from Czechoslovakia and percentage of population with a disability between the ages 34 and 64 in the United States with a correlation coefficient (R) of 0.220 and weighted average of 10.0%, a difference of 18.3%.
Czechoslovakian vs Immigrants from Czechoslovakia Disability Age 35 to 64

Disability Age 35 to 64 Correlation Summary

MeasurementCzechoslovakianImmigrants from Czechoslovakia
Minimum0.98%2.1%
Maximum67.3%37.2%
Range66.4%35.1%
Mean17.3%10.3%
Median13.8%9.5%
Interquartile 25% (IQ1)10.8%7.5%
Interquartile 75% (IQ3)20.9%11.4%
Interquartile Range (IQR)10.2%3.9%
Standard Deviation (Sample)13.4%5.6%
Standard Deviation (Population)13.3%5.5%

Similar Demographics by Disability Age 35 to 64

Demographics Similar to Czechoslovakians by Disability Age 35 to 64

In terms of disability age 35 to 64, the demographic groups most similar to Czechoslovakians are Immigrants from Bahamas (11.8%, a difference of 0.040%), Immigrants from West Indies (11.8%, a difference of 0.050%), Barbadian (11.8%, a difference of 0.10%), Alsatian (11.8%, a difference of 0.13%), and Honduran (11.8%, a difference of 0.15%).
DemographicsRating | RankDisability Age 35 to 64
Immigrants | Jamaica
11.8
/100
|
#212
Poor
11.7%
Yugoslavians
11.6
/100
|
#213
Poor
11.7%
Immigrants | Sudan
11.4
/100
|
#214
Poor
11.7%
Spanish American Indians
11.1
/100
|
#215
Poor
11.7%
Bahamians
10.7
/100
|
#216
Poor
11.8%
Barbadians
9.5
/100
|
#217
Tragic
11.8%
Immigrants | Bahamas
9.2
/100
|
#218
Tragic
11.8%
Czechoslovakians
9.0
/100
|
#219
Tragic
11.8%
Immigrants | West Indies
8.9
/100
|
#220
Tragic
11.8%
Alsatians
8.5
/100
|
#221
Tragic
11.8%
Hondurans
8.4
/100
|
#222
Tragic
11.8%
Immigrants | Honduras
8.4
/100
|
#223
Tragic
11.8%
Immigrants | Ghana
7.8
/100
|
#224
Tragic
11.8%
Immigrants | Belize
6.6
/100
|
#225
Tragic
11.9%
Scandinavians
6.4
/100
|
#226
Tragic
11.9%

Demographics Similar to Immigrants from Czechoslovakia by Disability Age 35 to 64

In terms of disability age 35 to 64, the demographic groups most similar to Immigrants from Czechoslovakia are Eastern European (10.0%, a difference of 0.12%), Immigrants from Romania (10.0%, a difference of 0.20%), Immigrants from Spain (10.0%, a difference of 0.22%), Immigrants from Poland (10.0%, a difference of 0.27%), and Immigrants from South America (9.9%, a difference of 0.34%).
DemographicsRating | RankDisability Age 35 to 64
South Americans
99.8
/100
|
#56
Exceptional
9.9%
Colombians
99.8
/100
|
#57
Exceptional
9.9%
Armenians
99.8
/100
|
#58
Exceptional
9.9%
Immigrants | Sweden
99.7
/100
|
#59
Exceptional
9.9%
Immigrants | South America
99.7
/100
|
#60
Exceptional
9.9%
Immigrants | Spain
99.7
/100
|
#61
Exceptional
10.0%
Eastern Europeans
99.7
/100
|
#62
Exceptional
10.0%
Immigrants | Czechoslovakia
99.7
/100
|
#63
Exceptional
10.0%
Immigrants | Romania
99.7
/100
|
#64
Exceptional
10.0%
Immigrants | Poland
99.6
/100
|
#65
Exceptional
10.0%
Cubans
99.6
/100
|
#66
Exceptional
10.0%
Immigrants | Uzbekistan
99.5
/100
|
#67
Exceptional
10.1%
Immigrants | Switzerland
99.5
/100
|
#68
Exceptional
10.1%
Immigrants | Eastern Europe
99.5
/100
|
#69
Exceptional
10.1%
Immigrants | Nicaragua
99.5
/100
|
#70
Exceptional
10.1%