Cuban vs Barbadian Hearing Disability
COMPARE
Cuban
Barbadian
Hearing Disability
Hearing Disability Comparison
Cubans
Barbadians
2.8%
HEARING DISABILITY
89.4/ 100
METRIC RATING
121st/ 347
METRIC RANK
2.5%
HEARING DISABILITY
99.9/ 100
METRIC RATING
15th/ 347
METRIC RANK
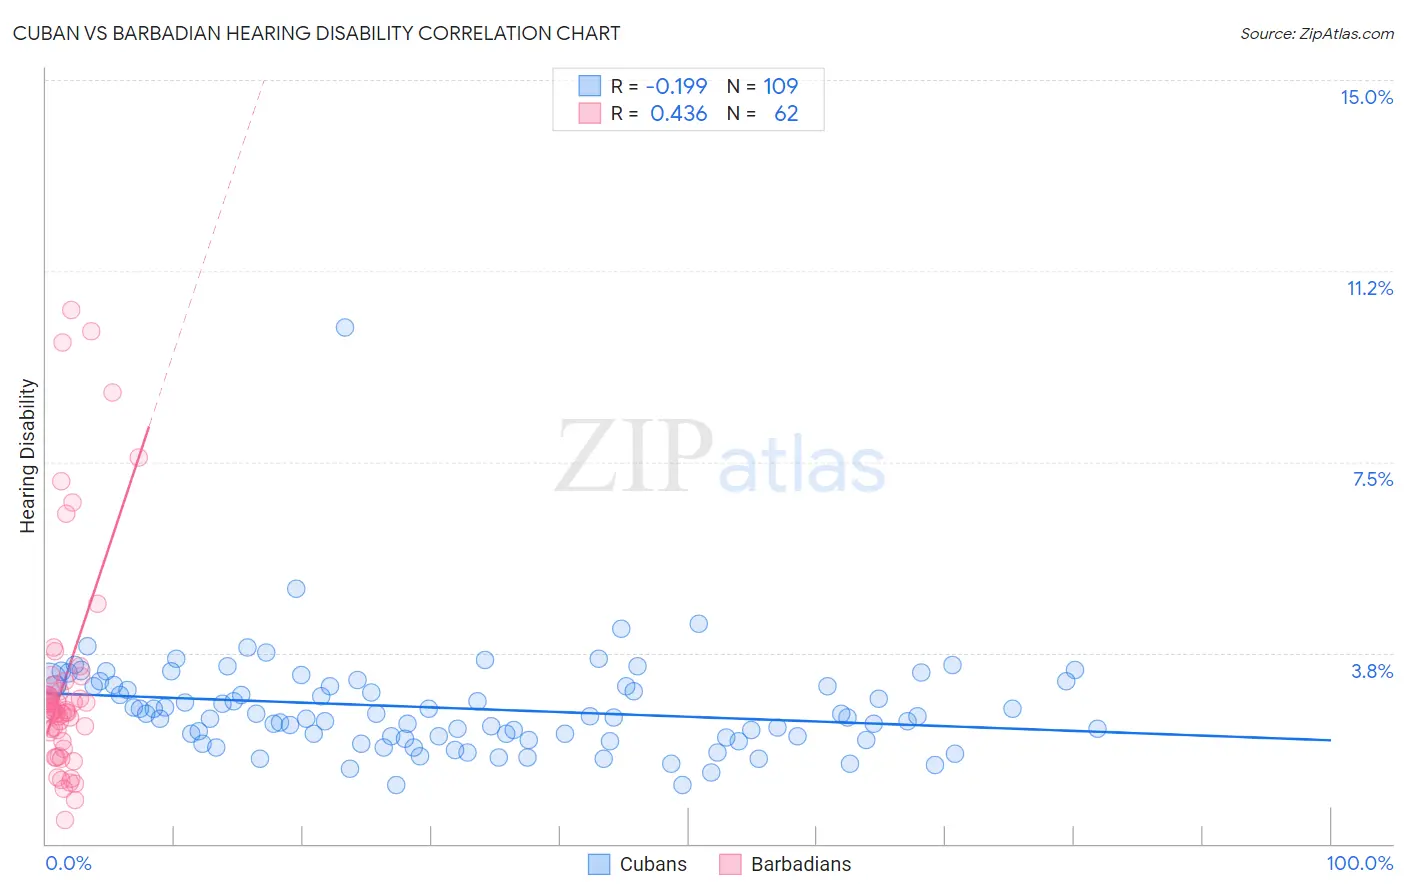
Cuban vs Barbadian Hearing Disability Correlation Chart
The statistical analysis conducted on geographies consisting of 449,105,745 people shows a poor negative correlation between the proportion of Cubans and percentage of population with hearing disability in the United States with a correlation coefficient (R) of -0.199 and weighted average of 2.8%. Similarly, the statistical analysis conducted on geographies consisting of 141,290,556 people shows a moderate positive correlation between the proportion of Barbadians and percentage of population with hearing disability in the United States with a correlation coefficient (R) of 0.436 and weighted average of 2.5%, a difference of 13.1%.
Hearing Disability Correlation Summary
| Measurement | Cuban | Barbadian |
| Minimum | 1.1% | 0.47% |
| Maximum | 10.1% | 10.5% |
| Range | 9.0% | 10.0% |
| Mean | 2.7% | 3.2% |
| Median | 2.5% | 2.6% |
| Interquartile 25% (IQ1) | 2.1% | 2.2% |
| Interquartile 75% (IQ3) | 3.1% | 3.1% |
| Interquartile Range (IQR) | 1.0% | 0.91% |
| Standard Deviation (Sample) | 1.0% | 2.2% |
| Standard Deviation (Population) | 1.0% | 2.2% |
Similar Demographics by Hearing Disability
Demographics Similar to Cubans by Hearing Disability
In terms of hearing disability, the demographic groups most similar to Cubans are Jordanian (2.8%, a difference of 0.030%), Liberian (2.8%, a difference of 0.090%), Kenyan (2.8%, a difference of 0.12%), Zimbabwean (2.8%, a difference of 0.14%), and Immigrants from Liberia (2.8%, a difference of 0.16%).
| Demographics | Rating | Rank | Hearing Disability |
| Cambodians | 91.1 /100 | #114 | Exceptional 2.8% |
| Immigrants | Latin America | 90.5 /100 | #115 | Exceptional 2.8% |
| Immigrants | Immigrants | 90.3 /100 | #116 | Exceptional 2.8% |
| Immigrants | Liberia | 90.0 /100 | #117 | Excellent 2.8% |
| Zimbabweans | 89.9 /100 | #118 | Excellent 2.8% |
| Kenyans | 89.8 /100 | #119 | Excellent 2.8% |
| Jordanians | 89.5 /100 | #120 | Excellent 2.8% |
| Cubans | 89.4 /100 | #121 | Excellent 2.8% |
| Liberians | 89.0 /100 | #122 | Excellent 2.8% |
| Immigrants | Zaire | 88.6 /100 | #123 | Excellent 2.9% |
| Bahamians | 88.6 /100 | #124 | Excellent 2.9% |
| Immigrants | Albania | 88.5 /100 | #125 | Excellent 2.9% |
| Immigrants | Sudan | 87.8 /100 | #126 | Excellent 2.9% |
| South American Indians | 86.9 /100 | #127 | Excellent 2.9% |
| Immigrants | Western Asia | 86.9 /100 | #128 | Excellent 2.9% |
Demographics Similar to Barbadians by Hearing Disability
In terms of hearing disability, the demographic groups most similar to Barbadians are Immigrants from West Indies (2.5%, a difference of 0.15%), Ecuadorian (2.5%, a difference of 0.30%), Immigrants from India (2.5%, a difference of 0.47%), Sierra Leonean (2.5%, a difference of 0.62%), and Trinidadian and Tobagonian (2.5%, a difference of 0.85%).
| Demographics | Rating | Rank | Hearing Disability |
| British West Indians | 100.0 /100 | #8 | Exceptional 2.4% |
| Immigrants | Dominican Republic | 100.0 /100 | #9 | Exceptional 2.4% |
| Immigrants | Ecuador | 99.9 /100 | #10 | Exceptional 2.5% |
| Immigrants | Trinidad and Tobago | 99.9 /100 | #11 | Exceptional 2.5% |
| Trinidadians and Tobagonians | 99.9 /100 | #12 | Exceptional 2.5% |
| Sierra Leoneans | 99.9 /100 | #13 | Exceptional 2.5% |
| Ecuadorians | 99.9 /100 | #14 | Exceptional 2.5% |
| Barbadians | 99.9 /100 | #15 | Exceptional 2.5% |
| Immigrants | West Indies | 99.9 /100 | #16 | Exceptional 2.5% |
| Immigrants | India | 99.9 /100 | #17 | Exceptional 2.5% |
| Dominicans | 99.8 /100 | #18 | Exceptional 2.5% |
| Thais | 99.8 /100 | #19 | Exceptional 2.5% |
| Immigrants | Bolivia | 99.8 /100 | #20 | Exceptional 2.5% |
| Ghanaians | 99.8 /100 | #21 | Exceptional 2.5% |
| Immigrants | Sierra Leone | 99.8 /100 | #22 | Exceptional 2.6% |