Costa Rican vs Immigrants from Kazakhstan Male Disability
COMPARE
Costa Rican
Immigrants from Kazakhstan
Male Disability
Male Disability Comparison
Costa Ricans
Immigrants from Kazakhstan
11.0%
MALE DISABILITY
78.0/ 100
METRIC RATING
145th/ 347
METRIC RANK
10.7%
MALE DISABILITY
95.9/ 100
METRIC RATING
100th/ 347
METRIC RANK
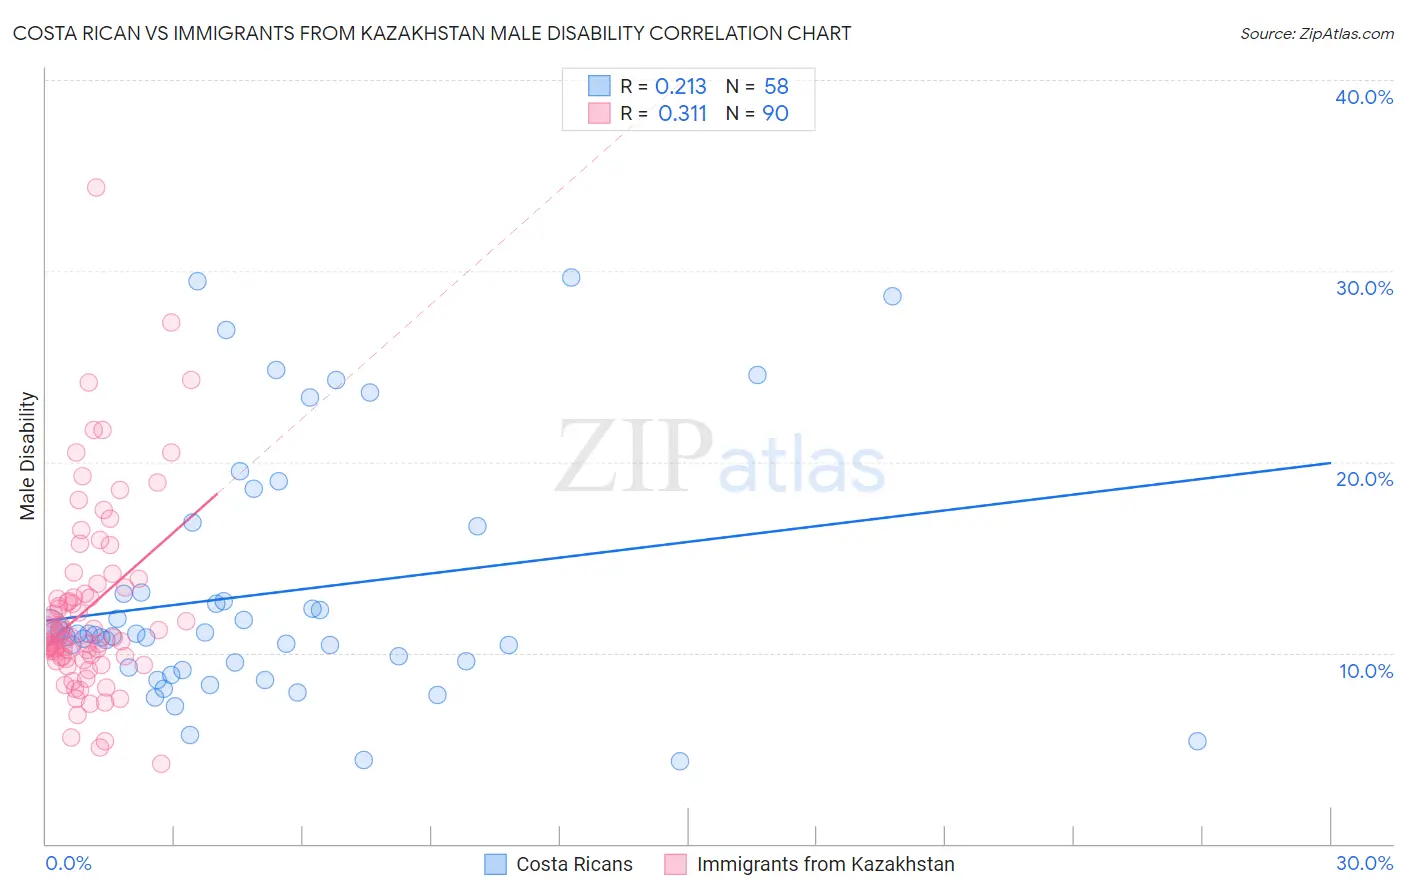
Costa Rican vs Immigrants from Kazakhstan Male Disability Correlation Chart
The statistical analysis conducted on geographies consisting of 253,572,614 people shows a weak positive correlation between the proportion of Costa Ricans and percentage of males with a disability in the United States with a correlation coefficient (R) of 0.213 and weighted average of 11.0%. Similarly, the statistical analysis conducted on geographies consisting of 124,443,289 people shows a mild positive correlation between the proportion of Immigrants from Kazakhstan and percentage of males with a disability in the United States with a correlation coefficient (R) of 0.311 and weighted average of 10.7%, a difference of 2.7%.
Male Disability Correlation Summary
| Measurement | Costa Rican | Immigrants from Kazakhstan |
| Minimum | 4.3% | 4.2% |
| Maximum | 29.6% | 34.4% |
| Range | 25.3% | 30.2% |
| Mean | 13.1% | 12.3% |
| Median | 11.0% | 10.8% |
| Interquartile 25% (IQ1) | 9.2% | 9.8% |
| Interquartile 75% (IQ3) | 13.1% | 13.4% |
| Interquartile Range (IQR) | 3.9% | 3.6% |
| Standard Deviation (Sample) | 6.5% | 5.0% |
| Standard Deviation (Population) | 6.4% | 4.9% |
Similar Demographics by Male Disability
Demographics Similar to Costa Ricans by Male Disability
In terms of male disability, the demographic groups most similar to Costa Ricans are Kenyan (11.0%, a difference of 0.010%), Korean (11.0%, a difference of 0.040%), Immigrants from Croatia (11.0%, a difference of 0.060%), Sudanese (11.0%, a difference of 0.070%), and Immigrants from Denmark (11.0%, a difference of 0.13%).
| Demographics | Rating | Rank | Male Disability |
| Nigerians | 81.9 /100 | #138 | Excellent 11.0% |
| South Africans | 81.7 /100 | #139 | Excellent 11.0% |
| Immigrants | Italy | 81.5 /100 | #140 | Excellent 11.0% |
| Arabs | 81.5 /100 | #141 | Excellent 11.0% |
| Immigrants | Sudan | 81.5 /100 | #142 | Excellent 11.0% |
| Moroccans | 80.7 /100 | #143 | Excellent 11.0% |
| Kenyans | 78.1 /100 | #144 | Good 11.0% |
| Costa Ricans | 78.0 /100 | #145 | Good 11.0% |
| Koreans | 77.5 /100 | #146 | Good 11.0% |
| Immigrants | Croatia | 77.3 /100 | #147 | Good 11.0% |
| Sudanese | 77.1 /100 | #148 | Good 11.0% |
| Immigrants | Denmark | 76.4 /100 | #149 | Good 11.0% |
| Immigrants | Guatemala | 75.1 /100 | #150 | Good 11.0% |
| Cubans | 74.9 /100 | #151 | Good 11.0% |
| Immigrants | Albania | 74.4 /100 | #152 | Good 11.0% |
Demographics Similar to Immigrants from Kazakhstan by Male Disability
In terms of male disability, the demographic groups most similar to Immigrants from Kazakhstan are Immigrants from Switzerland (10.7%, a difference of 0.070%), Immigrants from Greece (10.7%, a difference of 0.11%), Immigrants from Romania (10.7%, a difference of 0.21%), Immigrants from Eastern Europe (10.7%, a difference of 0.21%), and Uruguayan (10.7%, a difference of 0.22%).
| Demographics | Rating | Rank | Male Disability |
| Immigrants | St. Vincent and the Grenadines | 97.1 /100 | #93 | Exceptional 10.7% |
| Immigrants | Sweden | 96.9 /100 | #94 | Exceptional 10.7% |
| Chileans | 96.9 /100 | #95 | Exceptional 10.7% |
| Nicaraguans | 96.6 /100 | #96 | Exceptional 10.7% |
| Immigrants | Armenia | 96.6 /100 | #97 | Exceptional 10.7% |
| Immigrants | Romania | 96.5 /100 | #98 | Exceptional 10.7% |
| Immigrants | Switzerland | 96.1 /100 | #99 | Exceptional 10.7% |
| Immigrants | Kazakhstan | 95.9 /100 | #100 | Exceptional 10.7% |
| Immigrants | Greece | 95.6 /100 | #101 | Exceptional 10.7% |
| Immigrants | Eastern Europe | 95.3 /100 | #102 | Exceptional 10.7% |
| Uruguayans | 95.3 /100 | #103 | Exceptional 10.7% |
| Immigrants | Nigeria | 95.1 /100 | #104 | Exceptional 10.8% |
| Immigrants | Brazil | 95.0 /100 | #105 | Exceptional 10.8% |
| Immigrants | Syria | 94.9 /100 | #106 | Exceptional 10.8% |
| Immigrants | Eastern Africa | 94.3 /100 | #107 | Exceptional 10.8% |