Colombian vs Immigrants from Switzerland Disability Age 35 to 64
COMPARE
Colombian
Immigrants from Switzerland
Disability Age 35 to 64
Disability Age 35 to 64 Comparison
Colombians
Immigrants from Switzerland
9.9%
DISABILITY AGE 35 TO 64
99.8/ 100
METRIC RATING
57th/ 347
METRIC RANK
10.1%
DISABILITY AGE 35 TO 64
99.5/ 100
METRIC RATING
68th/ 347
METRIC RANK
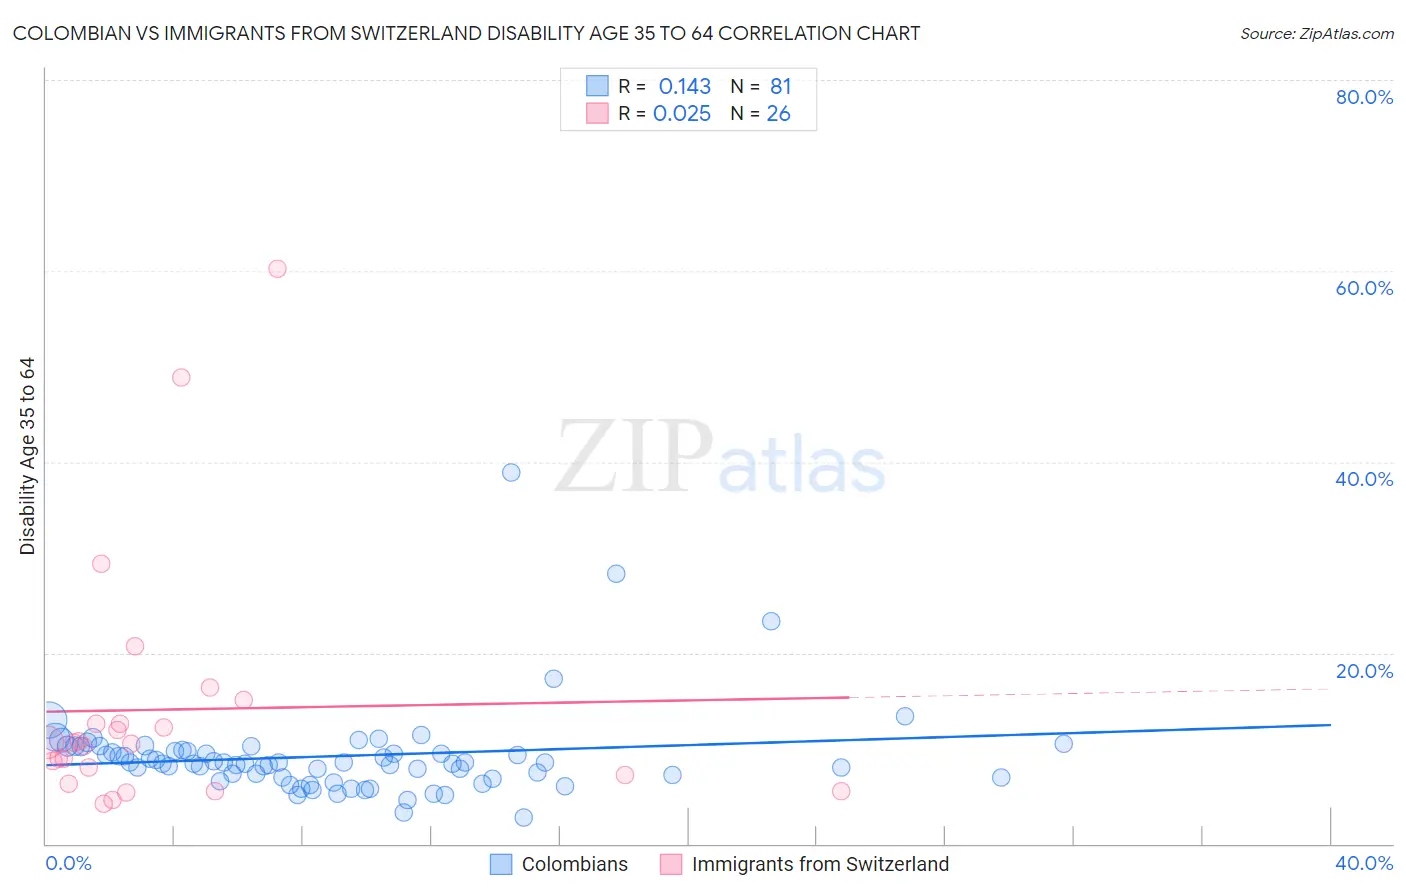
Colombian vs Immigrants from Switzerland Disability Age 35 to 64 Correlation Chart
The statistical analysis conducted on geographies consisting of 419,251,936 people shows a poor positive correlation between the proportion of Colombians and percentage of population with a disability between the ages 34 and 64 in the United States with a correlation coefficient (R) of 0.143 and weighted average of 9.9%. Similarly, the statistical analysis conducted on geographies consisting of 148,054,150 people shows no correlation between the proportion of Immigrants from Switzerland and percentage of population with a disability between the ages 34 and 64 in the United States with a correlation coefficient (R) of 0.025 and weighted average of 10.1%, a difference of 1.9%.
Disability Age 35 to 64 Correlation Summary
| Measurement | Colombian | Immigrants from Switzerland |
| Minimum | 2.7% | 4.1% |
| Maximum | 38.9% | 60.2% |
| Range | 36.2% | 56.0% |
| Mean | 9.2% | 14.1% |
| Median | 8.5% | 10.5% |
| Interquartile 25% (IQ1) | 6.9% | 7.2% |
| Interquartile 75% (IQ3) | 10.0% | 12.6% |
| Interquartile Range (IQR) | 3.1% | 5.4% |
| Standard Deviation (Sample) | 4.9% | 13.1% |
| Standard Deviation (Population) | 4.8% | 12.9% |
Demographics Similar to Colombians and Immigrants from Switzerland by Disability Age 35 to 64
In terms of disability age 35 to 64, the demographic groups most similar to Colombians are South American (9.9%, a difference of 0.010%), Armenian (9.9%, a difference of 0.10%), Peruvian (9.9%, a difference of 0.24%), Immigrants from Russia (9.8%, a difference of 0.30%), and Taiwanese (9.8%, a difference of 0.34%). Similarly, the demographic groups most similar to Immigrants from Switzerland are Immigrants from Eastern Europe (10.1%, a difference of 0.020%), Immigrants from Nicaragua (10.1%, a difference of 0.030%), Immigrants from Kazakhstan (10.1%, a difference of 0.050%), Immigrants from Uzbekistan (10.1%, a difference of 0.11%), and Immigrants from Northern Europe (10.1%, a difference of 0.25%).
| Demographics | Rating | Rank | Disability Age 35 to 64 |
| Immigrants | Bulgaria | 99.8 /100 | #52 | Exceptional 9.8% |
| Taiwanese | 99.8 /100 | #53 | Exceptional 9.8% |
| Immigrants | Russia | 99.8 /100 | #54 | Exceptional 9.8% |
| Peruvians | 99.8 /100 | #55 | Exceptional 9.9% |
| South Americans | 99.8 /100 | #56 | Exceptional 9.9% |
| Colombians | 99.8 /100 | #57 | Exceptional 9.9% |
| Armenians | 99.8 /100 | #58 | Exceptional 9.9% |
| Immigrants | Sweden | 99.7 /100 | #59 | Exceptional 9.9% |
| Immigrants | South America | 99.7 /100 | #60 | Exceptional 9.9% |
| Immigrants | Spain | 99.7 /100 | #61 | Exceptional 10.0% |
| Eastern Europeans | 99.7 /100 | #62 | Exceptional 10.0% |
| Immigrants | Czechoslovakia | 99.7 /100 | #63 | Exceptional 10.0% |
| Immigrants | Romania | 99.7 /100 | #64 | Exceptional 10.0% |
| Immigrants | Poland | 99.6 /100 | #65 | Exceptional 10.0% |
| Cubans | 99.6 /100 | #66 | Exceptional 10.0% |
| Immigrants | Uzbekistan | 99.5 /100 | #67 | Exceptional 10.1% |
| Immigrants | Switzerland | 99.5 /100 | #68 | Exceptional 10.1% |
| Immigrants | Eastern Europe | 99.5 /100 | #69 | Exceptional 10.1% |
| Immigrants | Nicaragua | 99.5 /100 | #70 | Exceptional 10.1% |
| Immigrants | Kazakhstan | 99.5 /100 | #71 | Exceptional 10.1% |
| Immigrants | Northern Europe | 99.5 /100 | #72 | Exceptional 10.1% |