Cheyenne vs Ottawa Disability Age 35 to 64
COMPARE
Cheyenne
Ottawa
Disability Age 35 to 64
Disability Age 35 to 64 Comparison
Cheyenne
Ottawa
13.6%
DISABILITY AGE 35 TO 64
0.0/ 100
METRIC RATING
298th/ 347
METRIC RANK
14.6%
DISABILITY AGE 35 TO 64
0.0/ 100
METRIC RATING
318th/ 347
METRIC RANK
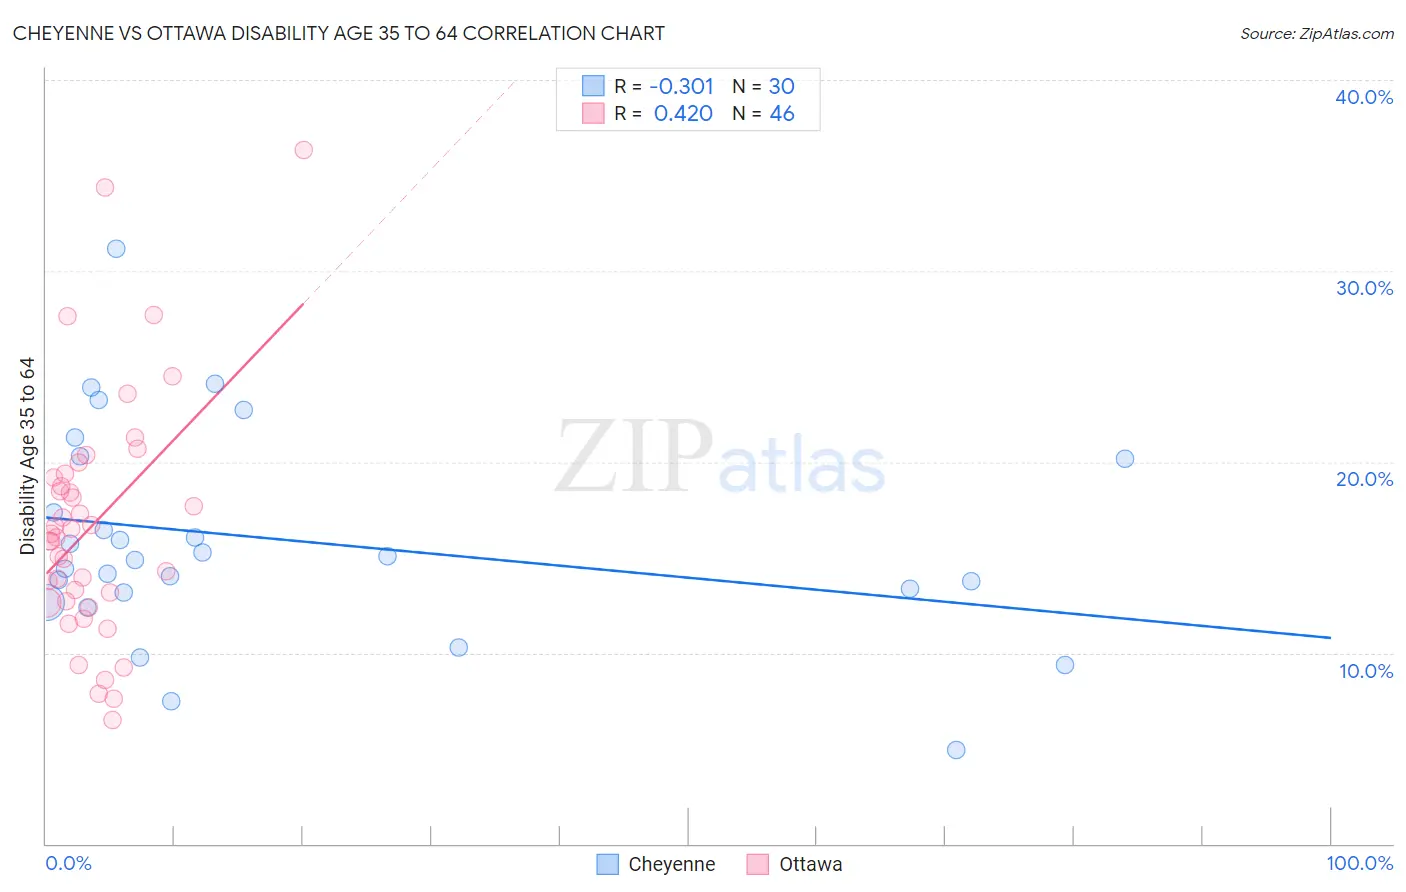
Cheyenne vs Ottawa Disability Age 35 to 64 Correlation Chart
The statistical analysis conducted on geographies consisting of 80,703,437 people shows a mild negative correlation between the proportion of Cheyenne and percentage of population with a disability between the ages 34 and 64 in the United States with a correlation coefficient (R) of -0.301 and weighted average of 13.6%. Similarly, the statistical analysis conducted on geographies consisting of 49,944,386 people shows a moderate positive correlation between the proportion of Ottawa and percentage of population with a disability between the ages 34 and 64 in the United States with a correlation coefficient (R) of 0.420 and weighted average of 14.6%, a difference of 7.3%.
Disability Age 35 to 64 Correlation Summary
| Measurement | Cheyenne | Ottawa |
| Minimum | 4.9% | 6.5% |
| Maximum | 31.1% | 36.4% |
| Range | 26.3% | 29.9% |
| Mean | 15.9% | 16.7% |
| Median | 15.0% | 16.1% |
| Interquartile 25% (IQ1) | 13.1% | 12.7% |
| Interquartile 75% (IQ3) | 20.2% | 19.2% |
| Interquartile Range (IQR) | 7.0% | 6.4% |
| Standard Deviation (Sample) | 5.6% | 6.3% |
| Standard Deviation (Population) | 5.5% | 6.2% |
Demographics Similar to Cheyenne and Ottawa by Disability Age 35 to 64
In terms of disability age 35 to 64, the demographic groups most similar to Cheyenne are Spanish American (13.7%, a difference of 0.20%), Delaware (13.7%, a difference of 0.28%), French American Indian (13.7%, a difference of 0.58%), Aleut (13.8%, a difference of 1.5%), and Sioux (13.9%, a difference of 1.7%). Similarly, the demographic groups most similar to Ottawa are Crow (14.6%, a difference of 0.070%), Osage (14.5%, a difference of 0.95%), Alaska Native (14.5%, a difference of 1.1%), Shoshone (14.5%, a difference of 1.2%), and Iroquois (14.4%, a difference of 1.9%).
| Demographics | Rating | Rank | Disability Age 35 to 64 |
| Cheyenne | 0.0 /100 | #298 | Tragic 13.6% |
| Spanish Americans | 0.0 /100 | #299 | Tragic 13.7% |
| Delaware | 0.0 /100 | #300 | Tragic 13.7% |
| French American Indians | 0.0 /100 | #301 | Tragic 13.7% |
| Aleuts | 0.0 /100 | #302 | Tragic 13.8% |
| Sioux | 0.0 /100 | #303 | Tragic 13.9% |
| Hopi | 0.0 /100 | #304 | Tragic 13.9% |
| Americans | 0.0 /100 | #305 | Tragic 13.9% |
| Immigrants | Yemen | 0.0 /100 | #306 | Tragic 14.0% |
| Blackfeet | 0.0 /100 | #307 | Tragic 14.1% |
| Inupiat | 0.0 /100 | #308 | Tragic 14.1% |
| Cree | 0.0 /100 | #309 | Tragic 14.1% |
| Cape Verdeans | 0.0 /100 | #310 | Tragic 14.1% |
| Immigrants | Azores | 0.0 /100 | #311 | Tragic 14.3% |
| Paiute | 0.0 /100 | #312 | Tragic 14.3% |
| Iroquois | 0.0 /100 | #313 | Tragic 14.4% |
| Shoshone | 0.0 /100 | #314 | Tragic 14.5% |
| Alaska Natives | 0.0 /100 | #315 | Tragic 14.5% |
| Osage | 0.0 /100 | #316 | Tragic 14.5% |
| Crow | 0.0 /100 | #317 | Tragic 14.6% |
| Ottawa | 0.0 /100 | #318 | Tragic 14.6% |