Cape Verdean vs Immigrants from Kuwait Disability Age 35 to 64
COMPARE
Cape Verdean
Immigrants from Kuwait
Disability Age 35 to 64
Disability Age 35 to 64 Comparison
Cape Verdeans
Immigrants from Kuwait
14.1%
DISABILITY AGE 35 TO 64
0.0/ 100
METRIC RATING
310th/ 347
METRIC RANK
10.2%
DISABILITY AGE 35 TO 64
99.1/ 100
METRIC RATING
85th/ 347
METRIC RANK
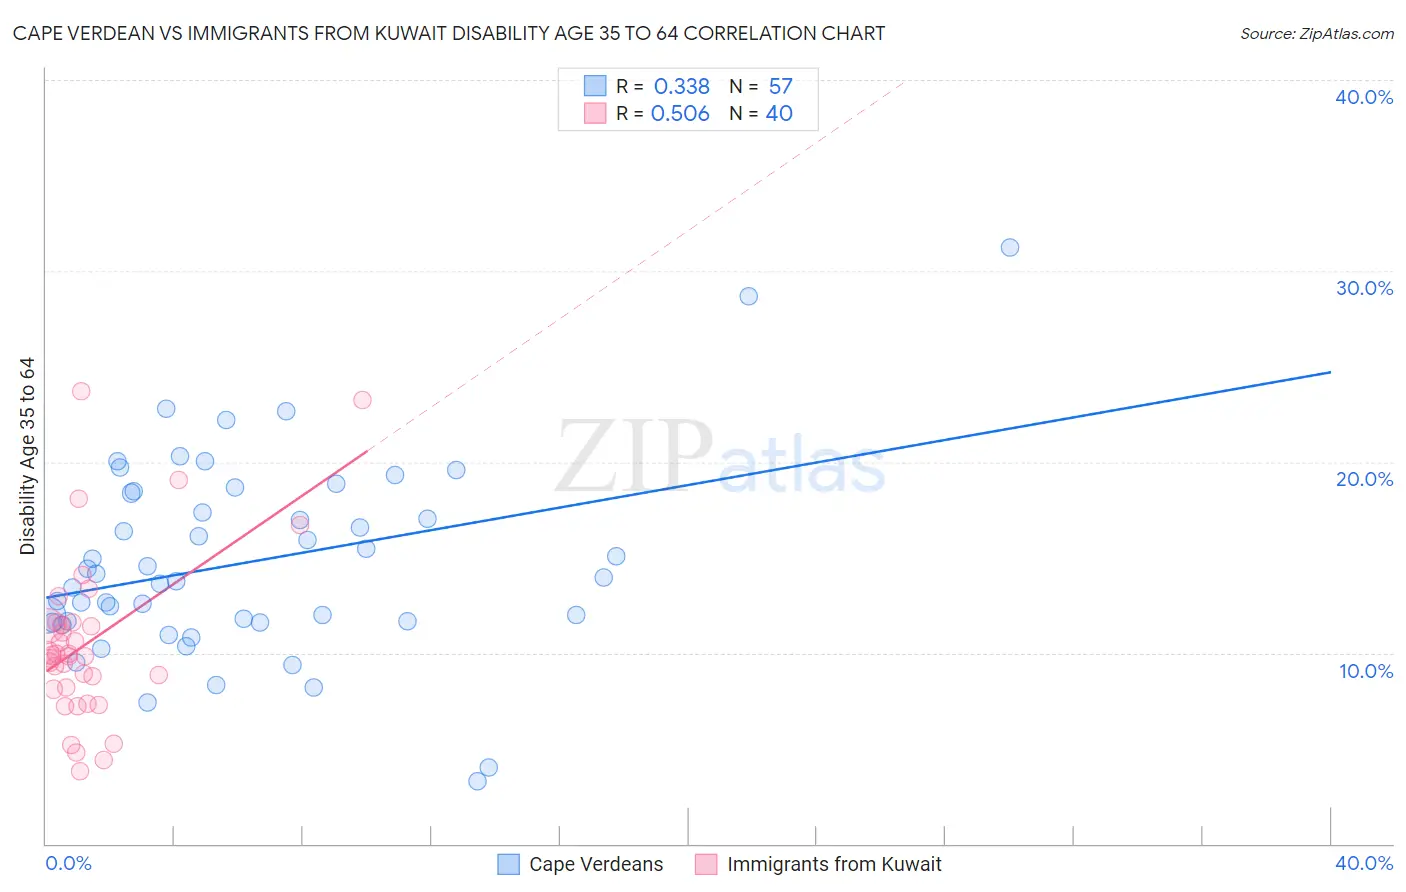
Cape Verdean vs Immigrants from Kuwait Disability Age 35 to 64 Correlation Chart
The statistical analysis conducted on geographies consisting of 107,539,998 people shows a mild positive correlation between the proportion of Cape Verdeans and percentage of population with a disability between the ages 34 and 64 in the United States with a correlation coefficient (R) of 0.338 and weighted average of 14.1%. Similarly, the statistical analysis conducted on geographies consisting of 136,873,084 people shows a substantial positive correlation between the proportion of Immigrants from Kuwait and percentage of population with a disability between the ages 34 and 64 in the United States with a correlation coefficient (R) of 0.506 and weighted average of 10.2%, a difference of 38.5%.
Disability Age 35 to 64 Correlation Summary
| Measurement | Cape Verdean | Immigrants from Kuwait |
| Minimum | 3.3% | 3.8% |
| Maximum | 31.2% | 23.7% |
| Range | 27.9% | 19.9% |
| Mean | 14.8% | 10.6% |
| Median | 14.0% | 9.9% |
| Interquartile 25% (IQ1) | 11.6% | 8.1% |
| Interquartile 75% (IQ3) | 18.4% | 11.5% |
| Interquartile Range (IQR) | 6.8% | 3.4% |
| Standard Deviation (Sample) | 5.2% | 4.5% |
| Standard Deviation (Population) | 5.1% | 4.4% |
Similar Demographics by Disability Age 35 to 64
Demographics Similar to Cape Verdeans by Disability Age 35 to 64
In terms of disability age 35 to 64, the demographic groups most similar to Cape Verdeans are Cree (14.1%, a difference of 0.47%), Inupiat (14.1%, a difference of 0.54%), Blackfeet (14.1%, a difference of 0.57%), Immigrants from Yemen (14.0%, a difference of 0.73%), and Immigrants from the Azores (14.3%, a difference of 0.92%).
| Demographics | Rating | Rank | Disability Age 35 to 64 |
| Sioux | 0.0 /100 | #303 | Tragic 13.9% |
| Hopi | 0.0 /100 | #304 | Tragic 13.9% |
| Americans | 0.0 /100 | #305 | Tragic 13.9% |
| Immigrants | Yemen | 0.0 /100 | #306 | Tragic 14.0% |
| Blackfeet | 0.0 /100 | #307 | Tragic 14.1% |
| Inupiat | 0.0 /100 | #308 | Tragic 14.1% |
| Cree | 0.0 /100 | #309 | Tragic 14.1% |
| Cape Verdeans | 0.0 /100 | #310 | Tragic 14.1% |
| Immigrants | Azores | 0.0 /100 | #311 | Tragic 14.3% |
| Paiute | 0.0 /100 | #312 | Tragic 14.3% |
| Iroquois | 0.0 /100 | #313 | Tragic 14.4% |
| Shoshone | 0.0 /100 | #314 | Tragic 14.5% |
| Alaska Natives | 0.0 /100 | #315 | Tragic 14.5% |
| Osage | 0.0 /100 | #316 | Tragic 14.5% |
| Crow | 0.0 /100 | #317 | Tragic 14.6% |
Demographics Similar to Immigrants from Kuwait by Disability Age 35 to 64
In terms of disability age 35 to 64, the demographic groups most similar to Immigrants from Kuwait are Immigrants from Europe (10.2%, a difference of 0.070%), Nicaraguan (10.2%, a difference of 0.080%), Sri Lankan (10.2%, a difference of 0.21%), Immigrants from Brazil (10.2%, a difference of 0.27%), and Russian (10.2%, a difference of 0.29%).
| Demographics | Rating | Rank | Disability Age 35 to 64 |
| Jordanians | 99.3 /100 | #78 | Exceptional 10.1% |
| Immigrants | Vietnam | 99.3 /100 | #79 | Exceptional 10.1% |
| Immigrants | Croatia | 99.3 /100 | #80 | Exceptional 10.2% |
| Latvians | 99.2 /100 | #81 | Exceptional 10.2% |
| Russians | 99.2 /100 | #82 | Exceptional 10.2% |
| Immigrants | Brazil | 99.2 /100 | #83 | Exceptional 10.2% |
| Sri Lankans | 99.2 /100 | #84 | Exceptional 10.2% |
| Immigrants | Kuwait | 99.1 /100 | #85 | Exceptional 10.2% |
| Immigrants | Europe | 99.1 /100 | #86 | Exceptional 10.2% |
| Nicaraguans | 99.1 /100 | #87 | Exceptional 10.2% |
| Chileans | 99.0 /100 | #88 | Exceptional 10.2% |
| Uruguayans | 99.0 /100 | #89 | Exceptional 10.2% |
| Afghans | 98.9 /100 | #90 | Exceptional 10.3% |
| Immigrants | Lebanon | 98.9 /100 | #91 | Exceptional 10.3% |
| Immigrants | Northern Africa | 98.7 /100 | #92 | Exceptional 10.3% |