Bolivian vs Immigrants from Israel Disability Age 65 to 74
COMPARE
Bolivian
Immigrants from Israel
Disability Age 65 to 74
Disability Age 65 to 74 Comparison
Bolivians
Immigrants from Israel
21.0%
DISABILITY AGE 65 TO 74
99.9/ 100
METRIC RATING
25th/ 347
METRIC RANK
19.9%
DISABILITY AGE 65 TO 74
100.0/ 100
METRIC RATING
5th/ 347
METRIC RANK
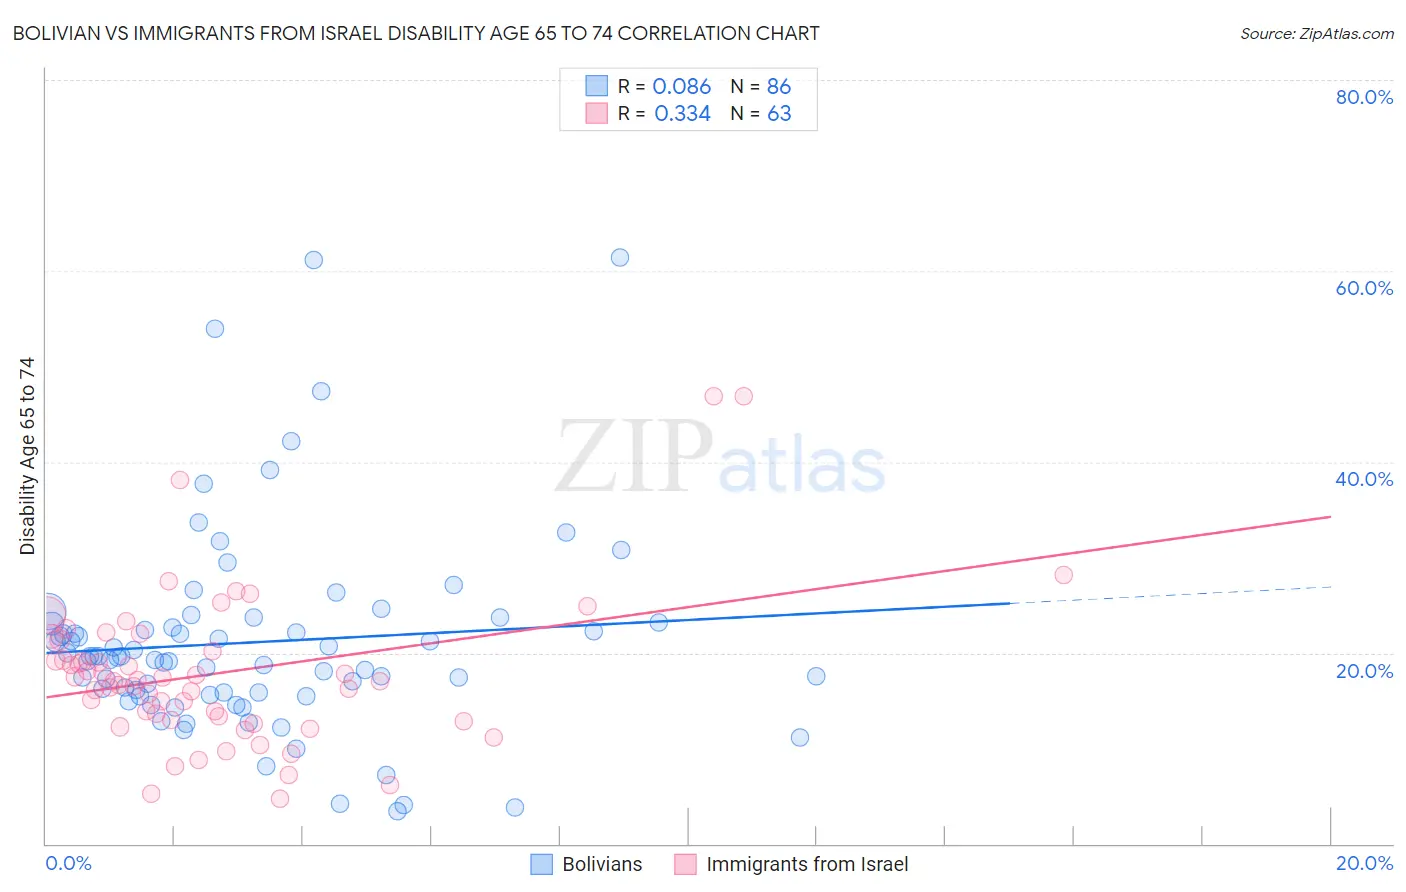
Bolivian vs Immigrants from Israel Disability Age 65 to 74 Correlation Chart
The statistical analysis conducted on geographies consisting of 184,504,529 people shows a slight positive correlation between the proportion of Bolivians and percentage of population with a disability between the ages 65 and 75 in the United States with a correlation coefficient (R) of 0.086 and weighted average of 21.0%. Similarly, the statistical analysis conducted on geographies consisting of 209,821,560 people shows a mild positive correlation between the proportion of Immigrants from Israel and percentage of population with a disability between the ages 65 and 75 in the United States with a correlation coefficient (R) of 0.334 and weighted average of 19.9%, a difference of 5.3%.
Disability Age 65 to 74 Correlation Summary
| Measurement | Bolivian | Immigrants from Israel |
| Minimum | 3.5% | 4.8% |
| Maximum | 61.4% | 46.9% |
| Range | 57.9% | 42.2% |
| Mean | 21.1% | 17.9% |
| Median | 19.6% | 17.0% |
| Interquartile 25% (IQ1) | 15.9% | 12.9% |
| Interquartile 75% (IQ3) | 23.1% | 21.4% |
| Interquartile Range (IQR) | 7.2% | 8.5% |
| Standard Deviation (Sample) | 10.6% | 8.0% |
| Standard Deviation (Population) | 10.5% | 8.0% |
Demographics Similar to Bolivians and Immigrants from Israel by Disability Age 65 to 74
In terms of disability age 65 to 74, the demographic groups most similar to Bolivians are Soviet Union (21.0%, a difference of 0.040%), Immigrants from Belgium (21.0%, a difference of 0.090%), Immigrants from Iran (20.9%, a difference of 0.40%), Immigrants from Bolivia (20.8%, a difference of 0.62%), and Okinawan (20.7%, a difference of 1.4%). Similarly, the demographic groups most similar to Immigrants from Israel are Iranian (19.9%, a difference of 0.11%), Cypriot (20.1%, a difference of 0.78%), Thai (20.1%, a difference of 0.82%), Immigrants from China (20.3%, a difference of 1.8%), and Immigrants from Eastern Asia (20.3%, a difference of 1.9%).
| Demographics | Rating | Rank | Disability Age 65 to 74 |
| Immigrants | Israel | 100.0 /100 | #5 | Exceptional 19.9% |
| Iranians | 100.0 /100 | #6 | Exceptional 19.9% |
| Cypriots | 100.0 /100 | #7 | Exceptional 20.1% |
| Thais | 100.0 /100 | #8 | Exceptional 20.1% |
| Immigrants | China | 100.0 /100 | #9 | Exceptional 20.3% |
| Immigrants | Eastern Asia | 100.0 /100 | #10 | Exceptional 20.3% |
| Immigrants | Ireland | 100.0 /100 | #11 | Exceptional 20.3% |
| Immigrants | Korea | 100.0 /100 | #12 | Exceptional 20.4% |
| Immigrants | Singapore | 100.0 /100 | #13 | Exceptional 20.4% |
| Indians (Asian) | 100.0 /100 | #14 | Exceptional 20.5% |
| Paraguayans | 100.0 /100 | #15 | Exceptional 20.5% |
| Immigrants | Lithuania | 100.0 /100 | #16 | Exceptional 20.5% |
| Immigrants | South Central Asia | 100.0 /100 | #17 | Exceptional 20.6% |
| Eastern Europeans | 100.0 /100 | #18 | Exceptional 20.6% |
| Burmese | 100.0 /100 | #19 | Exceptional 20.6% |
| Okinawans | 100.0 /100 | #20 | Exceptional 20.7% |
| Immigrants | Bolivia | 99.9 /100 | #21 | Exceptional 20.8% |
| Immigrants | Iran | 99.9 /100 | #22 | Exceptional 20.9% |
| Immigrants | Belgium | 99.9 /100 | #23 | Exceptional 21.0% |
| Soviet Union | 99.9 /100 | #24 | Exceptional 21.0% |
| Bolivians | 99.9 /100 | #25 | Exceptional 21.0% |