Bhutanese vs Immigrants from Lithuania Disability Age 35 to 64
COMPARE
Bhutanese
Immigrants from Lithuania
Disability Age 35 to 64
Disability Age 35 to 64 Comparison
Bhutanese
Immigrants from Lithuania
9.8%
DISABILITY AGE 35 TO 64
99.8/ 100
METRIC RATING
51st/ 347
METRIC RANK
9.6%
DISABILITY AGE 35 TO 64
99.9/ 100
METRIC RATING
31st/ 347
METRIC RANK
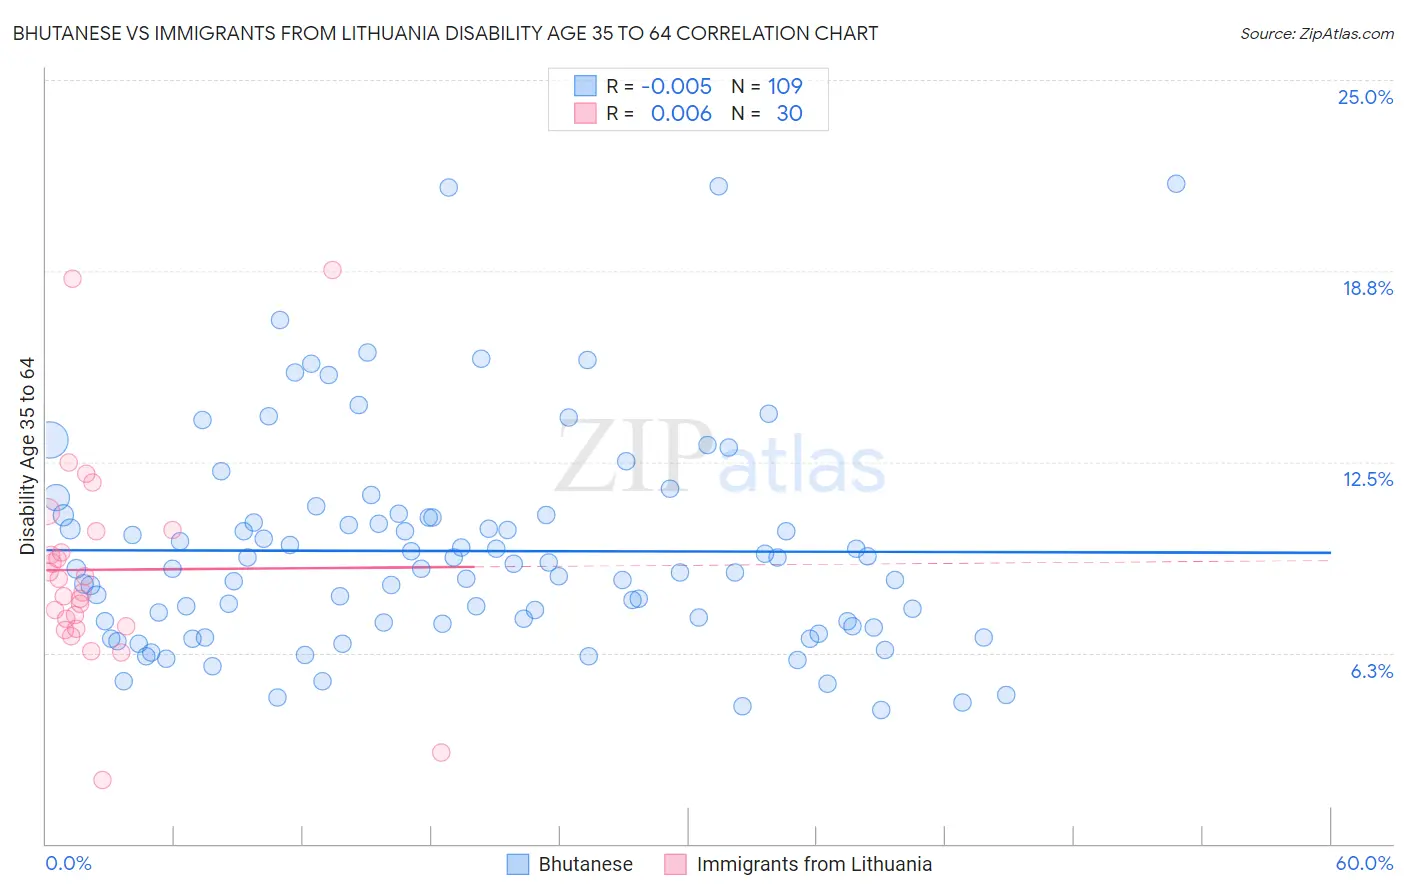
Bhutanese vs Immigrants from Lithuania Disability Age 35 to 64 Correlation Chart
The statistical analysis conducted on geographies consisting of 455,064,702 people shows no correlation between the proportion of Bhutanese and percentage of population with a disability between the ages 34 and 64 in the United States with a correlation coefficient (R) of -0.005 and weighted average of 9.8%. Similarly, the statistical analysis conducted on geographies consisting of 117,719,581 people shows no correlation between the proportion of Immigrants from Lithuania and percentage of population with a disability between the ages 34 and 64 in the United States with a correlation coefficient (R) of 0.006 and weighted average of 9.6%, a difference of 2.6%.
Disability Age 35 to 64 Correlation Summary
| Measurement | Bhutanese | Immigrants from Lithuania |
| Minimum | 4.4% | 2.1% |
| Maximum | 21.6% | 18.8% |
| Range | 17.2% | 16.7% |
| Mean | 9.6% | 9.0% |
| Median | 9.0% | 8.4% |
| Interquartile 25% (IQ1) | 7.2% | 7.1% |
| Interquartile 75% (IQ3) | 10.7% | 10.2% |
| Interquartile Range (IQR) | 3.6% | 3.1% |
| Standard Deviation (Sample) | 3.5% | 3.5% |
| Standard Deviation (Population) | 3.5% | 3.4% |
Demographics Similar to Bhutanese and Immigrants from Lithuania by Disability Age 35 to 64
In terms of disability age 35 to 64, the demographic groups most similar to Bhutanese are Paraguayan (9.8%, a difference of 0.080%), Immigrants from Greece (9.8%, a difference of 0.15%), Immigrants from Serbia (9.8%, a difference of 0.20%), Immigrants from Belgium (9.8%, a difference of 0.21%), and Cambodian (9.8%, a difference of 0.26%). Similarly, the demographic groups most similar to Immigrants from Lithuania are Turkish (9.7%, a difference of 0.65%), Immigrants from Indonesia (9.7%, a difference of 0.73%), Immigrants from Australia (9.7%, a difference of 0.80%), Bulgarian (9.7%, a difference of 0.90%), and Immigrants from Cuba (9.7%, a difference of 0.94%).
| Demographics | Rating | Rank | Disability Age 35 to 64 |
| Immigrants | Lithuania | 99.9 /100 | #31 | Exceptional 9.6% |
| Turks | 99.9 /100 | #32 | Exceptional 9.7% |
| Immigrants | Indonesia | 99.9 /100 | #33 | Exceptional 9.7% |
| Immigrants | Australia | 99.9 /100 | #34 | Exceptional 9.7% |
| Bulgarians | 99.9 /100 | #35 | Exceptional 9.7% |
| Immigrants | Cuba | 99.9 /100 | #36 | Exceptional 9.7% |
| Immigrants | Turkey | 99.9 /100 | #37 | Exceptional 9.7% |
| Egyptians | 99.9 /100 | #38 | Exceptional 9.7% |
| Immigrants | Belarus | 99.9 /100 | #39 | Exceptional 9.7% |
| Immigrants | Armenia | 99.9 /100 | #40 | Exceptional 9.7% |
| Israelis | 99.9 /100 | #41 | Exceptional 9.7% |
| Immigrants | Malaysia | 99.9 /100 | #42 | Exceptional 9.7% |
| Immigrants | Colombia | 99.9 /100 | #43 | Exceptional 9.8% |
| Immigrants | Egypt | 99.9 /100 | #44 | Exceptional 9.8% |
| Immigrants | Peru | 99.9 /100 | #45 | Exceptional 9.8% |
| Cambodians | 99.8 /100 | #46 | Exceptional 9.8% |
| Immigrants | Belgium | 99.8 /100 | #47 | Exceptional 9.8% |
| Immigrants | Serbia | 99.8 /100 | #48 | Exceptional 9.8% |
| Immigrants | Greece | 99.8 /100 | #49 | Exceptional 9.8% |
| Paraguayans | 99.8 /100 | #50 | Exceptional 9.8% |
| Bhutanese | 99.8 /100 | #51 | Exceptional 9.8% |