Bermudan vs Immigrants from Albania Disability Age 65 to 74
COMPARE
Bermudan
Immigrants from Albania
Disability Age 65 to 74
Disability Age 65 to 74 Comparison
Bermudans
Immigrants from Albania
24.2%
DISABILITY AGE 65 TO 74
8.2/ 100
METRIC RATING
225th/ 347
METRIC RANK
22.6%
DISABILITY AGE 65 TO 74
90.0/ 100
METRIC RATING
130th/ 347
METRIC RANK
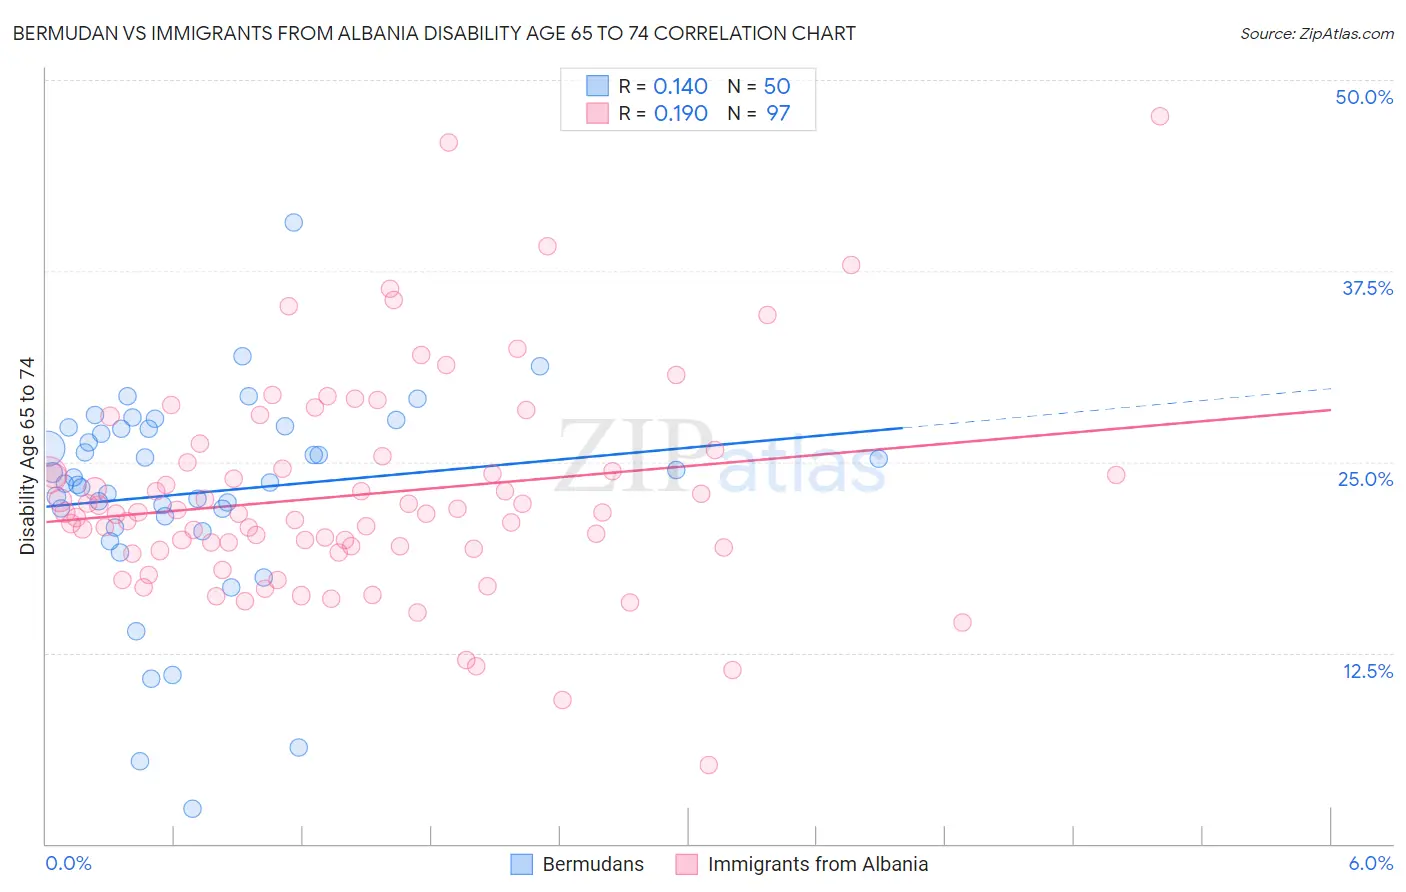
Bermudan vs Immigrants from Albania Disability Age 65 to 74 Correlation Chart
The statistical analysis conducted on geographies consisting of 55,715,607 people shows a poor positive correlation between the proportion of Bermudans and percentage of population with a disability between the ages 65 and 75 in the United States with a correlation coefficient (R) of 0.140 and weighted average of 24.2%. Similarly, the statistical analysis conducted on geographies consisting of 119,313,623 people shows a poor positive correlation between the proportion of Immigrants from Albania and percentage of population with a disability between the ages 65 and 75 in the United States with a correlation coefficient (R) of 0.190 and weighted average of 22.6%, a difference of 6.9%.
Disability Age 65 to 74 Correlation Summary
| Measurement | Bermudan | Immigrants from Albania |
| Minimum | 2.3% | 5.2% |
| Maximum | 40.7% | 47.6% |
| Range | 38.4% | 42.4% |
| Mean | 23.0% | 22.8% |
| Median | 23.8% | 21.7% |
| Interquartile 25% (IQ1) | 21.4% | 19.4% |
| Interquartile 75% (IQ3) | 27.2% | 25.2% |
| Interquartile Range (IQR) | 5.8% | 5.8% |
| Standard Deviation (Sample) | 6.9% | 7.0% |
| Standard Deviation (Population) | 6.8% | 6.9% |
Similar Demographics by Disability Age 65 to 74
Demographics Similar to Bermudans by Disability Age 65 to 74
In terms of disability age 65 to 74, the demographic groups most similar to Bermudans are Iraqi (24.2%, a difference of 0.010%), Nigerian (24.2%, a difference of 0.070%), Immigrants from Panama (24.1%, a difference of 0.090%), Immigrants from Middle Africa (24.1%, a difference of 0.13%), and Native Hawaiian (24.1%, a difference of 0.20%).
| Demographics | Rating | Rank | Disability Age 65 to 74 |
| Immigrants | Nigeria | 11.7 /100 | #218 | Poor 24.0% |
| Immigrants | Burma/Myanmar | 11.6 /100 | #219 | Poor 24.0% |
| Ghanaians | 10.4 /100 | #220 | Poor 24.1% |
| Immigrants | Nicaragua | 9.8 /100 | #221 | Tragic 24.1% |
| Native Hawaiians | 9.3 /100 | #222 | Tragic 24.1% |
| Immigrants | Middle Africa | 8.9 /100 | #223 | Tragic 24.1% |
| Immigrants | Panama | 8.6 /100 | #224 | Tragic 24.1% |
| Bermudans | 8.2 /100 | #225 | Tragic 24.2% |
| Iraqis | 8.1 /100 | #226 | Tragic 24.2% |
| Nigerians | 7.8 /100 | #227 | Tragic 24.2% |
| Whites/Caucasians | 6.6 /100 | #228 | Tragic 24.2% |
| Celtics | 6.4 /100 | #229 | Tragic 24.2% |
| Barbadians | 6.0 /100 | #230 | Tragic 24.3% |
| Immigrants | Thailand | 5.2 /100 | #231 | Tragic 24.3% |
| Immigrants | Zaire | 5.0 /100 | #232 | Tragic 24.3% |
Demographics Similar to Immigrants from Albania by Disability Age 65 to 74
In terms of disability age 65 to 74, the demographic groups most similar to Immigrants from Albania are Immigrants from Uruguay (22.6%, a difference of 0.010%), Immigrants from Costa Rica (22.6%, a difference of 0.070%), Immigrants from Nepal (22.6%, a difference of 0.090%), Costa Rican (22.6%, a difference of 0.13%), and Northern European (22.6%, a difference of 0.17%).
| Demographics | Rating | Rank | Disability Age 65 to 74 |
| Hungarians | 93.3 /100 | #123 | Exceptional 22.4% |
| Norwegians | 92.5 /100 | #124 | Exceptional 22.5% |
| Immigrants | Western Europe | 92.3 /100 | #125 | Exceptional 22.5% |
| Lebanese | 92.2 /100 | #126 | Exceptional 22.5% |
| Slovaks | 91.6 /100 | #127 | Exceptional 22.5% |
| Immigrants | Costa Rica | 90.4 /100 | #128 | Exceptional 22.6% |
| Immigrants | Uruguay | 90.1 /100 | #129 | Exceptional 22.6% |
| Immigrants | Albania | 90.0 /100 | #130 | Excellent 22.6% |
| Immigrants | Nepal | 89.4 /100 | #131 | Excellent 22.6% |
| Costa Ricans | 89.2 /100 | #132 | Excellent 22.6% |
| Northern Europeans | 88.9 /100 | #133 | Excellent 22.6% |
| Afghans | 88.6 /100 | #134 | Excellent 22.6% |
| Immigrants | Ukraine | 88.4 /100 | #135 | Excellent 22.6% |
| Ethiopians | 87.9 /100 | #136 | Excellent 22.7% |
| Taiwanese | 87.6 /100 | #137 | Excellent 22.7% |