Belgian vs Immigrants from Zaire Disability Age 35 to 64
COMPARE
Belgian
Immigrants from Zaire
Disability Age 35 to 64
Disability Age 35 to 64 Comparison
Belgians
Immigrants from Zaire
11.7%
DISABILITY AGE 35 TO 64
13.1/ 100
METRIC RATING
210th/ 347
METRIC RANK
12.5%
DISABILITY AGE 35 TO 64
0.4/ 100
METRIC RATING
263rd/ 347
METRIC RANK
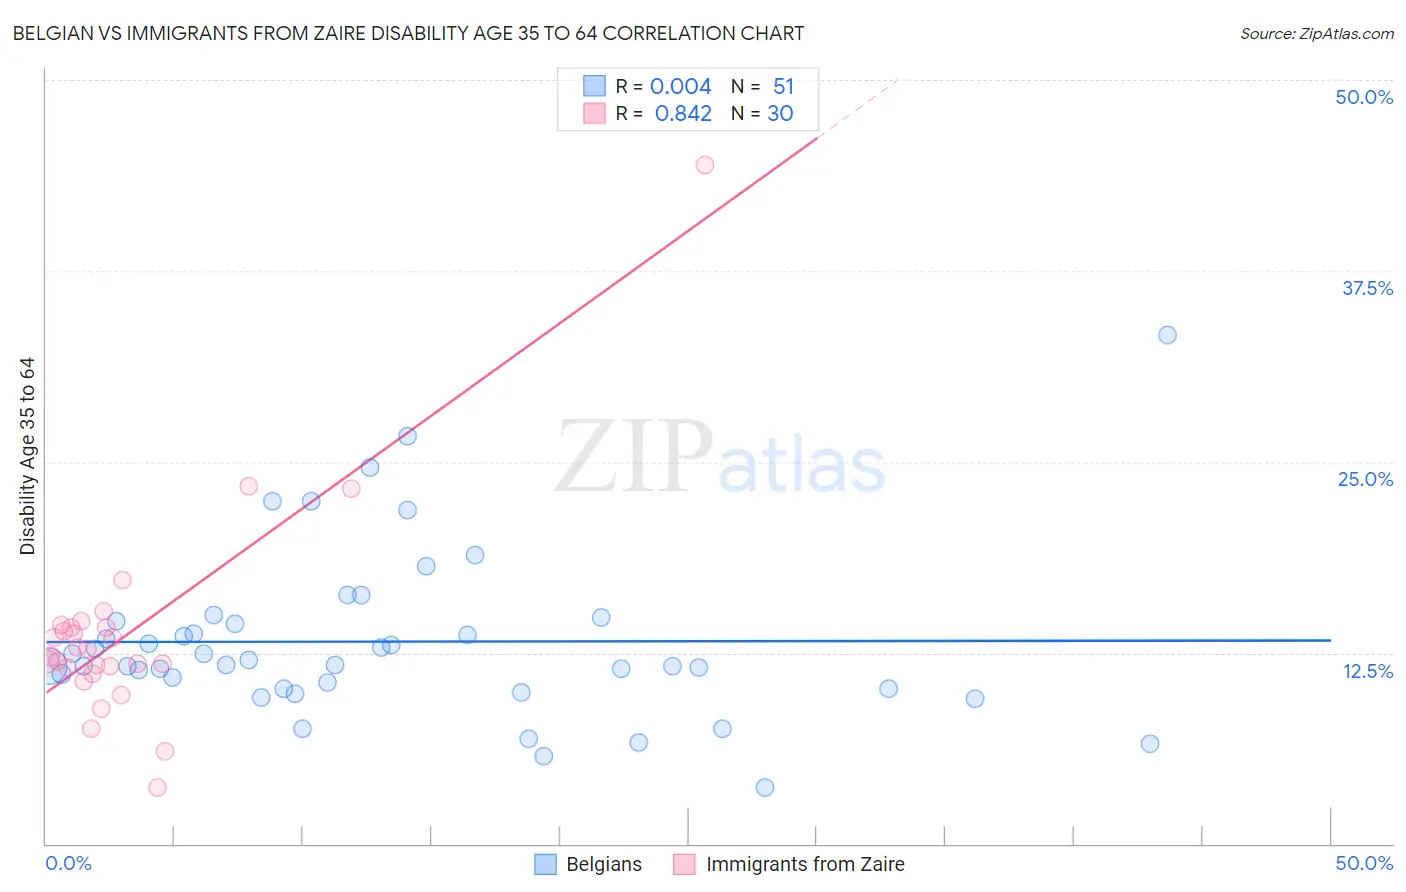
Belgian vs Immigrants from Zaire Disability Age 35 to 64 Correlation Chart
The statistical analysis conducted on geographies consisting of 355,809,909 people shows no correlation between the proportion of Belgians and percentage of population with a disability between the ages 34 and 64 in the United States with a correlation coefficient (R) of 0.004 and weighted average of 11.7%. Similarly, the statistical analysis conducted on geographies consisting of 107,240,518 people shows a very strong positive correlation between the proportion of Immigrants from Zaire and percentage of population with a disability between the ages 34 and 64 in the United States with a correlation coefficient (R) of 0.842 and weighted average of 12.5%, a difference of 7.0%.
Disability Age 35 to 64 Correlation Summary
| Measurement | Belgian | Immigrants from Zaire |
| Minimum | 3.7% | 3.7% |
| Maximum | 33.3% | 44.4% |
| Range | 29.6% | 40.8% |
| Mean | 13.2% | 13.8% |
| Median | 11.7% | 12.5% |
| Interquartile 25% (IQ1) | 10.2% | 11.5% |
| Interquartile 75% (IQ3) | 14.6% | 14.2% |
| Interquartile Range (IQR) | 4.4% | 2.7% |
| Standard Deviation (Sample) | 5.5% | 7.0% |
| Standard Deviation (Population) | 5.4% | 6.9% |
Similar Demographics by Disability Age 35 to 64
Demographics Similar to Belgians by Disability Age 35 to 64
In terms of disability age 35 to 64, the demographic groups most similar to Belgians are Canadian (11.7%, a difference of 0.010%), European (11.7%, a difference of 0.070%), Immigrants from Jamaica (11.7%, a difference of 0.23%), Guatemalan (11.7%, a difference of 0.26%), and Yugoslavian (11.7%, a difference of 0.26%).
| Demographics | Rating | Rank | Disability Age 35 to 64 |
| British | 17.0 /100 | #203 | Poor 11.6% |
| Nigerians | 16.3 /100 | #204 | Poor 11.6% |
| Slavs | 15.5 /100 | #205 | Poor 11.7% |
| Native Hawaiians | 14.8 /100 | #206 | Poor 11.7% |
| Ghanaians | 14.8 /100 | #207 | Poor 11.7% |
| Guatemalans | 14.6 /100 | #208 | Poor 11.7% |
| Europeans | 13.5 /100 | #209 | Poor 11.7% |
| Belgians | 13.1 /100 | #210 | Poor 11.7% |
| Canadians | 13.0 /100 | #211 | Poor 11.7% |
| Immigrants | Jamaica | 11.8 /100 | #212 | Poor 11.7% |
| Yugoslavians | 11.6 /100 | #213 | Poor 11.7% |
| Immigrants | Sudan | 11.4 /100 | #214 | Poor 11.7% |
| Spanish American Indians | 11.1 /100 | #215 | Poor 11.7% |
| Bahamians | 10.7 /100 | #216 | Poor 11.8% |
| Barbadians | 9.5 /100 | #217 | Tragic 11.8% |
Demographics Similar to Immigrants from Zaire by Disability Age 35 to 64
In terms of disability age 35 to 64, the demographic groups most similar to Immigrants from Zaire are Immigrants from Portugal (12.5%, a difference of 0.010%), Marshallese (12.5%, a difference of 0.12%), Senegalese (12.5%, a difference of 0.25%), Malaysian (12.5%, a difference of 0.33%), and German Russian (12.5%, a difference of 0.48%).
| Demographics | Rating | Rank | Disability Age 35 to 64 |
| Scottish | 0.8 /100 | #256 | Tragic 12.4% |
| Mexicans | 0.7 /100 | #257 | Tragic 12.4% |
| Welsh | 0.6 /100 | #258 | Tragic 12.4% |
| English | 0.6 /100 | #259 | Tragic 12.4% |
| German Russians | 0.5 /100 | #260 | Tragic 12.5% |
| Malaysians | 0.5 /100 | #261 | Tragic 12.5% |
| Senegalese | 0.5 /100 | #262 | Tragic 12.5% |
| Immigrants | Zaire | 0.4 /100 | #263 | Tragic 12.5% |
| Immigrants | Portugal | 0.4 /100 | #264 | Tragic 12.5% |
| Marshallese | 0.4 /100 | #265 | Tragic 12.5% |
| Whites/Caucasians | 0.3 /100 | #266 | Tragic 12.6% |
| Sub-Saharan Africans | 0.2 /100 | #267 | Tragic 12.6% |
| Immigrants | Dominica | 0.2 /100 | #268 | Tragic 12.7% |
| Spanish | 0.2 /100 | #269 | Tragic 12.7% |
| French | 0.2 /100 | #270 | Tragic 12.7% |