Austrian vs Assyrian/Chaldean/Syriac Disability Age 35 to 64
COMPARE
Austrian
Assyrian/Chaldean/Syriac
Disability Age 35 to 64
Disability Age 35 to 64 Comparison
Austrians
Assyrians/Chaldeans/Syriacs
11.1%
DISABILITY AGE 35 TO 64
63.2/ 100
METRIC RATING
167th/ 347
METRIC RANK
10.5%
DISABILITY AGE 35 TO 64
96.8/ 100
METRIC RATING
112th/ 347
METRIC RANK
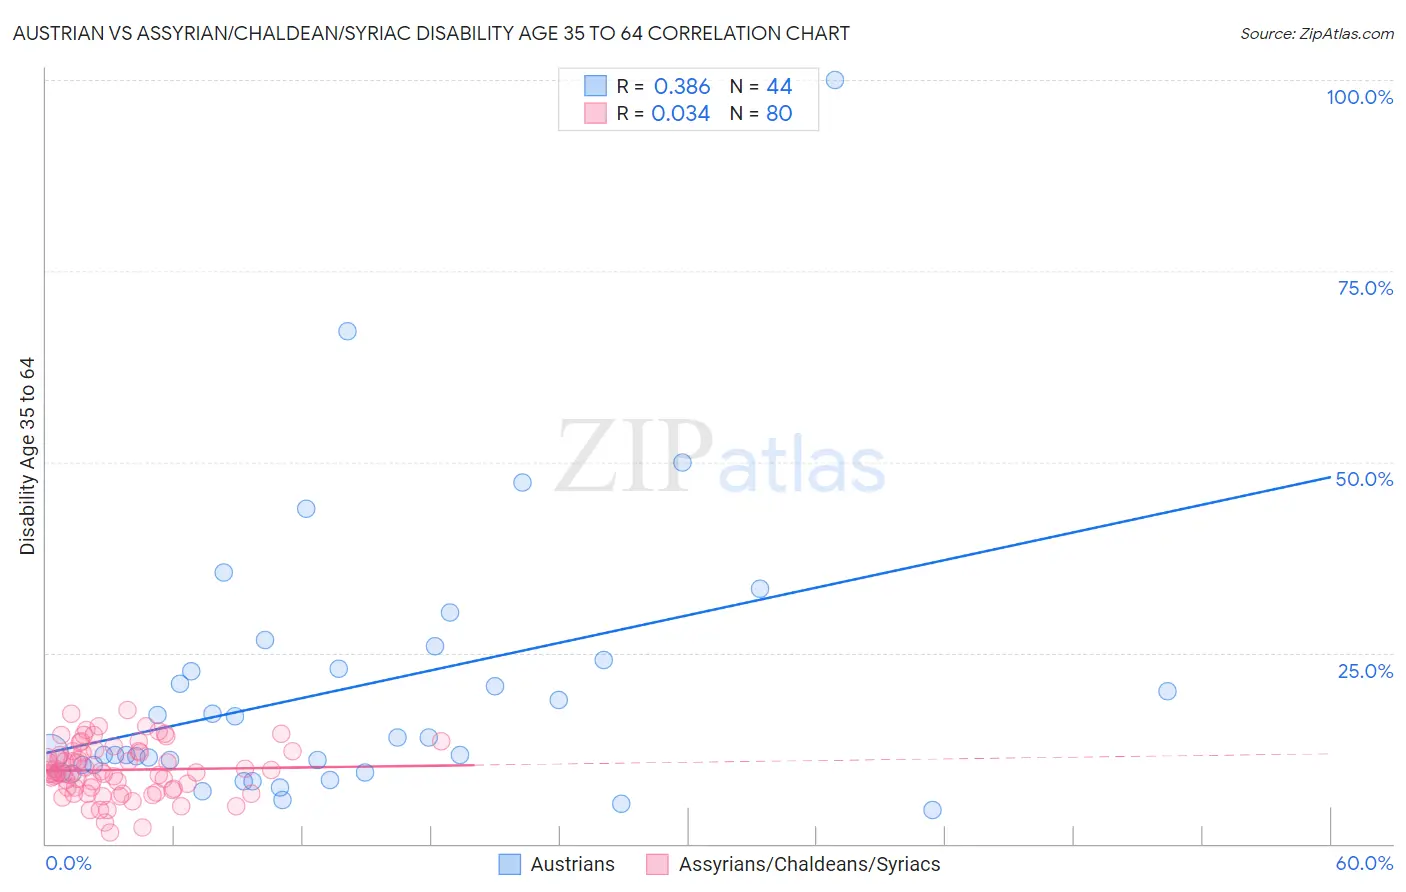
Austrian vs Assyrian/Chaldean/Syriac Disability Age 35 to 64 Correlation Chart
The statistical analysis conducted on geographies consisting of 451,701,119 people shows a mild positive correlation between the proportion of Austrians and percentage of population with a disability between the ages 34 and 64 in the United States with a correlation coefficient (R) of 0.386 and weighted average of 11.1%. Similarly, the statistical analysis conducted on geographies consisting of 110,296,626 people shows no correlation between the proportion of Assyrians/Chaldeans/Syriacs and percentage of population with a disability between the ages 34 and 64 in the United States with a correlation coefficient (R) of 0.034 and weighted average of 10.5%, a difference of 6.2%.
Disability Age 35 to 64 Correlation Summary
| Measurement | Austrian | Assyrian/Chaldean/Syriac |
| Minimum | 4.4% | 1.5% |
| Maximum | 100.0% | 17.5% |
| Range | 95.6% | 16.0% |
| Mean | 20.3% | 9.7% |
| Median | 12.9% | 9.4% |
| Interquartile 25% (IQ1) | 9.8% | 7.2% |
| Interquartile 75% (IQ3) | 23.5% | 12.1% |
| Interquartile Range (IQR) | 13.7% | 4.9% |
| Standard Deviation (Sample) | 18.2% | 3.4% |
| Standard Deviation (Population) | 18.0% | 3.4% |
Similar Demographics by Disability Age 35 to 64
Demographics Similar to Austrians by Disability Age 35 to 64
In terms of disability age 35 to 64, the demographic groups most similar to Austrians are Immigrants from Haiti (11.1%, a difference of 0.050%), Immigrants from Western Europe (11.1%, a difference of 0.17%), Pakistani (11.1%, a difference of 0.23%), Immigrants from St. Vincent and the Grenadines (11.1%, a difference of 0.30%), and Central American (11.2%, a difference of 0.35%).
| Demographics | Rating | Rank | Disability Age 35 to 64 |
| Croatians | 73.1 /100 | #160 | Good 11.0% |
| Immigrants | Guyana | 70.1 /100 | #161 | Good 11.1% |
| Immigrants | Grenada | 68.4 /100 | #162 | Good 11.1% |
| Immigrants | St. Vincent and the Grenadines | 66.6 /100 | #163 | Good 11.1% |
| Pakistanis | 65.8 /100 | #164 | Good 11.1% |
| Immigrants | Western Europe | 65.2 /100 | #165 | Good 11.1% |
| Immigrants | Haiti | 63.8 /100 | #166 | Good 11.1% |
| Austrians | 63.2 /100 | #167 | Good 11.1% |
| Central Americans | 59.1 /100 | #168 | Average 11.2% |
| Haitians | 59.0 /100 | #169 | Average 11.2% |
| Immigrants | Uganda | 58.0 /100 | #170 | Average 11.2% |
| Immigrants | Trinidad and Tobago | 55.9 /100 | #171 | Average 11.2% |
| Italians | 55.6 /100 | #172 | Average 11.2% |
| Lebanese | 51.8 /100 | #173 | Average 11.3% |
| Immigrants | Fiji | 50.0 /100 | #174 | Average 11.3% |
Demographics Similar to Assyrians/Chaldeans/Syriacs by Disability Age 35 to 64
In terms of disability age 35 to 64, the demographic groups most similar to Assyrians/Chaldeans/Syriacs are Brazilian (10.5%, a difference of 0.030%), Tongan (10.5%, a difference of 0.12%), Immigrants from Morocco (10.5%, a difference of 0.17%), Korean (10.5%, a difference of 0.24%), and Immigrants from Ethiopia (10.5%, a difference of 0.30%).
| Demographics | Rating | Rank | Disability Age 35 to 64 |
| Macedonians | 97.8 /100 | #105 | Exceptional 10.4% |
| Immigrants | Hungary | 97.6 /100 | #106 | Exceptional 10.4% |
| Zimbabweans | 97.4 /100 | #107 | Exceptional 10.4% |
| Ethiopians | 97.4 /100 | #108 | Exceptional 10.5% |
| Immigrants | Ethiopia | 97.2 /100 | #109 | Exceptional 10.5% |
| Koreans | 97.1 /100 | #110 | Exceptional 10.5% |
| Brazilians | 96.9 /100 | #111 | Exceptional 10.5% |
| Assyrians/Chaldeans/Syriacs | 96.8 /100 | #112 | Exceptional 10.5% |
| Tongans | 96.6 /100 | #113 | Exceptional 10.5% |
| Immigrants | Morocco | 96.6 /100 | #114 | Exceptional 10.5% |
| Immigrants | Netherlands | 96.3 /100 | #115 | Exceptional 10.5% |
| Immigrants | Nepal | 95.9 /100 | #116 | Exceptional 10.6% |
| Immigrants | South Eastern Asia | 95.7 /100 | #117 | Exceptional 10.6% |
| Immigrants | Moldova | 95.5 /100 | #118 | Exceptional 10.6% |
| Luxembourgers | 95.5 /100 | #119 | Exceptional 10.6% |