Argentinean vs Immigrants from Guatemala Disability Age 18 to 34
COMPARE
Argentinean
Immigrants from Guatemala
Disability Age 18 to 34
Disability Age 18 to 34 Comparison
Argentineans
Immigrants from Guatemala
5.8%
DISABILITY AGE 18 TO 34
99.9/ 100
METRIC RATING
33rd/ 347
METRIC RANK
6.3%
DISABILITY AGE 18 TO 34
93.4/ 100
METRIC RATING
121st/ 347
METRIC RANK
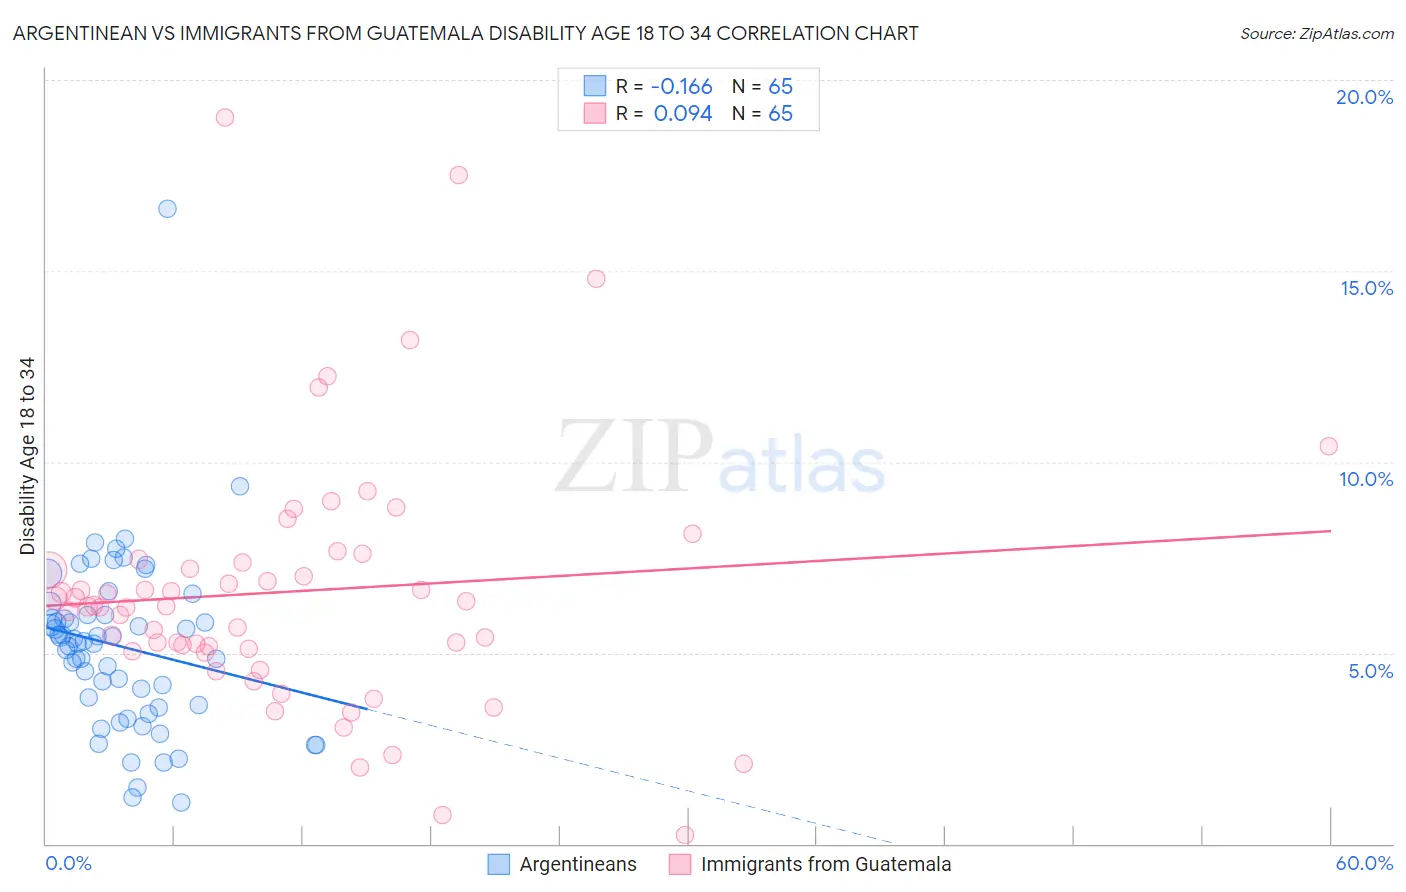
Argentinean vs Immigrants from Guatemala Disability Age 18 to 34 Correlation Chart
The statistical analysis conducted on geographies consisting of 296,774,562 people shows a poor negative correlation between the proportion of Argentineans and percentage of population with a disability between the ages 18 and 35 in the United States with a correlation coefficient (R) of -0.166 and weighted average of 5.8%. Similarly, the statistical analysis conducted on geographies consisting of 376,602,313 people shows a slight positive correlation between the proportion of Immigrants from Guatemala and percentage of population with a disability between the ages 18 and 35 in the United States with a correlation coefficient (R) of 0.094 and weighted average of 6.3%, a difference of 9.1%.
Disability Age 18 to 34 Correlation Summary
| Measurement | Argentinean | Immigrants from Guatemala |
| Minimum | 1.1% | 0.22% |
| Maximum | 16.6% | 19.0% |
| Range | 15.6% | 18.8% |
| Mean | 5.2% | 6.6% |
| Median | 5.3% | 6.2% |
| Interquartile 25% (IQ1) | 3.6% | 5.1% |
| Interquartile 75% (IQ3) | 6.0% | 7.4% |
| Interquartile Range (IQR) | 2.4% | 2.3% |
| Standard Deviation (Sample) | 2.3% | 3.4% |
| Standard Deviation (Population) | 2.3% | 3.3% |
Similar Demographics by Disability Age 18 to 34
Demographics Similar to Argentineans by Disability Age 18 to 34
In terms of disability age 18 to 34, the demographic groups most similar to Argentineans are Iranian (5.8%, a difference of 0.020%), Immigrants from Barbados (5.8%, a difference of 0.020%), Venezuelan (5.8%, a difference of 0.19%), Immigrants from Pakistan (5.8%, a difference of 0.35%), and Immigrants from Lithuania (5.8%, a difference of 0.41%).
| Demographics | Rating | Rank | Disability Age 18 to 34 |
| Immigrants | Colombia | 100.0 /100 | #26 | Exceptional 5.7% |
| Immigrants | Venezuela | 99.9 /100 | #27 | Exceptional 5.7% |
| Soviet Union | 99.9 /100 | #28 | Exceptional 5.7% |
| Immigrants | Ecuador | 99.9 /100 | #29 | Exceptional 5.7% |
| Immigrants | Pakistan | 99.9 /100 | #30 | Exceptional 5.8% |
| Iranians | 99.9 /100 | #31 | Exceptional 5.8% |
| Immigrants | Barbados | 99.9 /100 | #32 | Exceptional 5.8% |
| Argentineans | 99.9 /100 | #33 | Exceptional 5.8% |
| Venezuelans | 99.9 /100 | #34 | Exceptional 5.8% |
| Immigrants | Lithuania | 99.9 /100 | #35 | Exceptional 5.8% |
| Ecuadorians | 99.9 /100 | #36 | Exceptional 5.8% |
| Armenians | 99.9 /100 | #37 | Exceptional 5.8% |
| Immigrants | South America | 99.9 /100 | #38 | Exceptional 5.8% |
| Asians | 99.9 /100 | #39 | Exceptional 5.8% |
| Bolivians | 99.9 /100 | #40 | Exceptional 5.8% |
Demographics Similar to Immigrants from Guatemala by Disability Age 18 to 34
In terms of disability age 18 to 34, the demographic groups most similar to Immigrants from Guatemala are Immigrants from Ukraine (6.3%, a difference of 0.0%), Immigrants from Czechoslovakia (6.3%, a difference of 0.020%), Chilean (6.3%, a difference of 0.030%), Immigrants from Nepal (6.3%, a difference of 0.090%), and Costa Rican (6.3%, a difference of 0.12%).
| Demographics | Rating | Rank | Disability Age 18 to 34 |
| Immigrants | South Eastern Asia | 94.4 /100 | #114 | Exceptional 6.3% |
| Koreans | 94.1 /100 | #115 | Exceptional 6.3% |
| Immigrants | Costa Rica | 94.0 /100 | #116 | Exceptional 6.3% |
| Immigrants | Jordan | 94.0 /100 | #117 | Exceptional 6.3% |
| Immigrants | Nepal | 93.7 /100 | #118 | Exceptional 6.3% |
| Chileans | 93.5 /100 | #119 | Exceptional 6.3% |
| Immigrants | Ukraine | 93.4 /100 | #120 | Exceptional 6.3% |
| Immigrants | Guatemala | 93.4 /100 | #121 | Exceptional 6.3% |
| Immigrants | Czechoslovakia | 93.3 /100 | #122 | Exceptional 6.3% |
| Costa Ricans | 92.9 /100 | #123 | Exceptional 6.3% |
| Immigrants | Morocco | 92.9 /100 | #124 | Exceptional 6.3% |
| Macedonians | 92.6 /100 | #125 | Exceptional 6.3% |
| Immigrants | Switzerland | 92.5 /100 | #126 | Exceptional 6.3% |
| West Indians | 92.0 /100 | #127 | Exceptional 6.3% |
| Chinese | 91.9 /100 | #128 | Exceptional 6.3% |