Argentinean vs Immigrants from Burma/Myanmar Disability Age 35 to 64
COMPARE
Argentinean
Immigrants from Burma/Myanmar
Disability Age 35 to 64
Disability Age 35 to 64 Comparison
Argentineans
Immigrants from Burma/Myanmar
9.4%
DISABILITY AGE 35 TO 64
100.0/ 100
METRIC RATING
23rd/ 347
METRIC RANK
12.3%
DISABILITY AGE 35 TO 64
1.2/ 100
METRIC RATING
250th/ 347
METRIC RANK
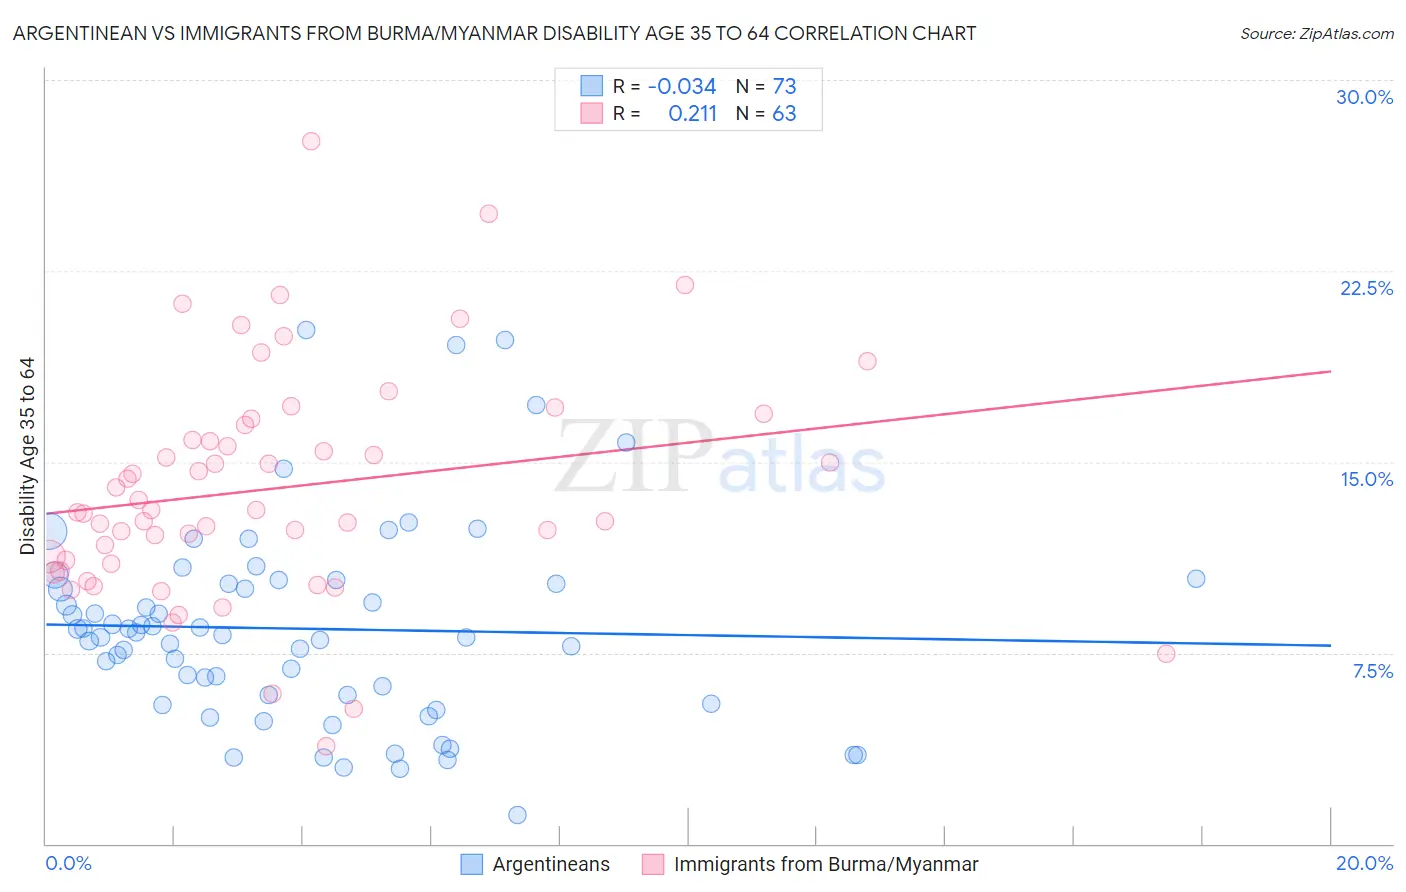
Argentinean vs Immigrants from Burma/Myanmar Disability Age 35 to 64 Correlation Chart
The statistical analysis conducted on geographies consisting of 296,962,722 people shows no correlation between the proportion of Argentineans and percentage of population with a disability between the ages 34 and 64 in the United States with a correlation coefficient (R) of -0.034 and weighted average of 9.4%. Similarly, the statistical analysis conducted on geographies consisting of 172,272,577 people shows a weak positive correlation between the proportion of Immigrants from Burma/Myanmar and percentage of population with a disability between the ages 34 and 64 in the United States with a correlation coefficient (R) of 0.211 and weighted average of 12.3%, a difference of 30.8%.
Disability Age 35 to 64 Correlation Summary
| Measurement | Argentinean | Immigrants from Burma/Myanmar |
| Minimum | 1.1% | 3.9% |
| Maximum | 20.2% | 27.6% |
| Range | 19.0% | 23.7% |
| Mean | 8.4% | 14.0% |
| Median | 8.2% | 13.1% |
| Interquartile 25% (IQ1) | 5.7% | 11.0% |
| Interquartile 75% (IQ3) | 10.3% | 16.5% |
| Interquartile Range (IQR) | 4.6% | 5.5% |
| Standard Deviation (Sample) | 3.9% | 4.5% |
| Standard Deviation (Population) | 3.9% | 4.5% |
Similar Demographics by Disability Age 35 to 64
Demographics Similar to Argentineans by Disability Age 35 to 64
In terms of disability age 35 to 64, the demographic groups most similar to Argentineans are Asian (9.4%, a difference of 0.010%), Cypriot (9.4%, a difference of 0.22%), Okinawan (9.4%, a difference of 0.25%), Venezuelan (9.4%, a difference of 0.31%), and Immigrants from Argentina (9.3%, a difference of 0.68%).
| Demographics | Rating | Rank | Disability Age 35 to 64 |
| Immigrants | Korea | 100.0 /100 | #16 | Exceptional 9.0% |
| Burmese | 100.0 /100 | #17 | Exceptional 9.2% |
| Soviet Union | 100.0 /100 | #18 | Exceptional 9.2% |
| Immigrants | Venezuela | 100.0 /100 | #19 | Exceptional 9.3% |
| Immigrants | Argentina | 100.0 /100 | #20 | Exceptional 9.3% |
| Okinawans | 100.0 /100 | #21 | Exceptional 9.4% |
| Cypriots | 100.0 /100 | #22 | Exceptional 9.4% |
| Argentineans | 100.0 /100 | #23 | Exceptional 9.4% |
| Asians | 100.0 /100 | #24 | Exceptional 9.4% |
| Venezuelans | 100.0 /100 | #25 | Exceptional 9.4% |
| Immigrants | Sri Lanka | 100.0 /100 | #26 | Exceptional 9.5% |
| Immigrants | Asia | 100.0 /100 | #27 | Exceptional 9.5% |
| Immigrants | Pakistan | 100.0 /100 | #28 | Exceptional 9.5% |
| Immigrants | Ireland | 100.0 /100 | #29 | Exceptional 9.5% |
| Immigrants | Japan | 100.0 /100 | #30 | Exceptional 9.5% |
Demographics Similar to Immigrants from Burma/Myanmar by Disability Age 35 to 64
In terms of disability age 35 to 64, the demographic groups most similar to Immigrants from Burma/Myanmar are German (12.3%, a difference of 0.080%), Hispanic or Latino (12.3%, a difference of 0.13%), Spaniard (12.3%, a difference of 0.16%), Immigrants from Senegal (12.2%, a difference of 0.26%), and Guamanian/Chamorro (12.2%, a difference of 0.29%).
| Demographics | Rating | Rank | Disability Age 35 to 64 |
| Slovaks | 2.7 /100 | #243 | Tragic 12.1% |
| Finns | 2.3 /100 | #244 | Tragic 12.1% |
| Immigrants | Mexico | 2.2 /100 | #245 | Tragic 12.1% |
| Guamanians/Chamorros | 1.4 /100 | #246 | Tragic 12.2% |
| Immigrants | Senegal | 1.3 /100 | #247 | Tragic 12.2% |
| Spaniards | 1.3 /100 | #248 | Tragic 12.3% |
| Hispanics or Latinos | 1.3 /100 | #249 | Tragic 12.3% |
| Immigrants | Burma/Myanmar | 1.2 /100 | #250 | Tragic 12.3% |
| Germans | 1.1 /100 | #251 | Tragic 12.3% |
| Irish | 1.0 /100 | #252 | Tragic 12.3% |
| Dutch | 1.0 /100 | #253 | Tragic 12.3% |
| Hawaiians | 0.9 /100 | #254 | Tragic 12.3% |
| Japanese | 0.8 /100 | #255 | Tragic 12.3% |
| Scottish | 0.8 /100 | #256 | Tragic 12.4% |
| Mexicans | 0.7 /100 | #257 | Tragic 12.4% |