Arapaho vs Immigrants from Nicaragua Disability Age 18 to 34

COMPARE

Arapaho
Race
Ancestry
AfghanAfricanAlaska NativeAlaskan AthabascanAlbanianAleutAlsatianAmericanApacheArabArapahoArgentineanArmenianAssyrian/Chaldean/SyriacAustralianAustrianBahamianBangladeshiBarbadianBasqueBelgianBelizeanBermudanBhutaneseBlackfeetBolivianBrazilianBritishBritish West IndianBulgarianBurmeseCajunCambodianCanadianCape VerdeanCarpatho RusynCelticCentral AmericanCentral American IndianCherokeeCheyenneChickasawChileanChineseChippewaChoctawColombianColvilleComancheCosta RicanCreeCreekCroatianCrowCubanCypriotCzechCzechoslovakianDanishDelawareDominicanDutchDutch West IndianEastern EuropeanEcuadorianEgyptianEnglishEstonianEthiopianEuropeanFijianFilipinoFinnishFrenchFrench American IndianFrench CanadianGermanGerman RussianGhanaianGreekGuamanian/ChamorroGuatemalanGuyaneseHaitianHmongHonduranHopiHoumaHungarianIcelanderIndian (Asian)IndonesianInupiatIranianIraqiIrishIroquoisIsraeliItalianJamaicanJapaneseJordanianKenyanKiowaKoreanLaotianLatvianLebaneseLiberianLithuanianLumbeeLuxembourgerMacedonianMalaysianMalteseMarshalleseMenomineeMexicanMexican American IndianMongolianMoroccanNative HawaiianNavajoNepaleseNew ZealanderNicaraguanNigerianNorthern EuropeanNorwegianOkinawanOsageOttawaPaiutePakistaniPalestinianPanamanianParaguayanPennsylvania GermanPeruvianPimaPolishPortuguesePotawatomiPuebloPuerto RicanPuget Sound SalishRomanianRussianSalvadoranSamoanScandinavianScotch-IrishScottishSeminoleSenegaleseSerbianShoshoneSierra LeoneanSiouxSlavicSlovakSloveneSomaliSouth AfricanSouth AmericanSouth American IndianSoviet UnionSpaniardSpanishSpanish AmericanSpanish American IndianSri LankanSubsaharan AfricanSudaneseSwedishSwissSyrianTaiwaneseThaiTlingit-HaidaTohono O'OdhamTonganTrinidadian and TobagonianTsimshianTurkishU.S. Virgin IslanderUgandanUkrainianUruguayanUteVenezuelanVietnameseWelshWest IndianYakamaYaquiYugoslavianYumanYup'ikZimbabwean
Immigration
NonimmigrantsImmigrantsAfghanistanAfricaAlbaniaArgentinaArmeniaAsiaAustraliaAustriaBahamasBangladeshBarbadosBelarusBelgiumBelizeBoliviaBosnia and HerzegovinaBrazilBulgariaBurma/MyanmarCabo VerdeCambodiaCameroonCanadaCaribbeanCentral AmericaChileChinaColombiaCongoCosta RicaCroatiaCubaCzechoslovakiaDenmarkDominicaDominican RepublicEastern AfricaEastern AsiaEastern EuropeEcuadorEgyptEl SalvadorEnglandEritreaEthiopiaEuropeFijiFranceGermanyGhanaGreeceGrenadaGuatemalaGuyanaHaitiHondurasHong KongHungaryIndiaIndonesiaIranIraqIrelandIsraelItalyJamaicaJapanJordanKazakhstanKenyaKoreaKuwaitLaosLatin AmericaLatviaLebanonLiberiaLithuaniaMalaysiaMexicoMicronesiaMiddle AfricaMoldovaMoroccoNepalNetherlandsNigeriaNorth AmericaNorth MacedoniaNorthern AfricaNorthern EuropeNorwayOceaniaPakistanPanamaPeruPhilippinesPolandPortugalRomaniaRussiaSaudi ArabiaScotlandSenegalSerbiaSierra LeoneSingaporeSomaliaSouth AfricaSouth AmericaSouth Central AsiaSouth Eastern AsiaSouthern EuropeSpainSri LankaSt. Vincent and the GrenadinesSudanSwedenSwitzerlandSyriaTaiwanThailandTrinidad and TobagoTurkeyUgandaUkraineUruguayUzbekistanVenezuelaVietnamWest IndiesWestern AfricaWestern AsiaWestern EuropeYemenZaireZimbabweAzores
Immigrants from Nicaragua
Race
Ancestry
AfghanAfricanAlaska NativeAlaskan AthabascanAlbanianAleutAlsatianAmericanApacheArabArgentineanArmenianAssyrian/Chaldean/SyriacAustralianAustrianBahamianBangladeshiBarbadianBasqueBelgianBelizeanBermudanBhutaneseBlackfeetBolivianBrazilianBritishBritish West IndianBulgarianBurmeseCajunCambodianCanadianCape VerdeanCarpatho RusynCelticCentral AmericanCentral American IndianCherokeeCheyenneChickasawChileanChineseChippewaChoctawColombianColvilleComancheCosta RicanCreeCreekCroatianCrowCubanCypriotCzechCzechoslovakianDanishDelawareDominicanDutchDutch West IndianEastern EuropeanEcuadorianEgyptianEnglishEstonianEthiopianEuropeanFijianFilipinoFinnishFrenchFrench American IndianFrench CanadianGermanGerman RussianGhanaianGreekGuamanian/ChamorroGuatemalanGuyaneseHaitianHmongHonduranHopiHoumaHungarianIcelanderIndian (Asian)IndonesianInupiatIranianIraqiIrishIroquoisIsraeliItalianJamaicanJapaneseJordanianKenyanKiowaKoreanLaotianLatvianLebaneseLiberianLithuanianLumbeeLuxembourgerMacedonianMalaysianMalteseMarshalleseMenomineeMexicanMexican American IndianMongolianMoroccanNative HawaiianNavajoNepaleseNew ZealanderNicaraguanNigerianNorthern EuropeanNorwegianOkinawanOsageOttawaPaiutePakistaniPalestinianPanamanianParaguayanPennsylvania GermanPeruvianPimaPolishPortuguesePotawatomiPuebloPuerto RicanPuget Sound SalishRomanianRussianSalvadoranSamoanScandinavianScotch-IrishScottishSeminoleSenegaleseSerbianShoshoneSierra LeoneanSiouxSlavicSlovakSloveneSomaliSouth AfricanSouth AmericanSouth American IndianSoviet UnionSpaniardSpanishSpanish AmericanSpanish American IndianSri LankanSubsaharan AfricanSudaneseSwedishSwissSyrianTaiwaneseThaiTlingit-HaidaTohono O'OdhamTonganTrinidadian and TobagonianTsimshianTurkishU.S. Virgin IslanderUgandanUkrainianUruguayanUteVenezuelanVietnameseWelshWest IndianYakamaYaquiYugoslavianYumanYup'ikZimbabwean
Immigration
NonimmigrantsImmigrantsAfghanistanAfricaAlbaniaArgentinaArmeniaAsiaAustraliaAustriaBahamasBangladeshBarbadosBelarusBelgiumBelizeBoliviaBosnia and HerzegovinaBrazilBulgariaBurma/MyanmarCabo VerdeCambodiaCameroonCanadaCaribbeanCentral AmericaChileChinaColombiaCongoCosta RicaCroatiaCubaCzechoslovakiaDenmarkDominicaDominican RepublicEastern AfricaEastern AsiaEastern EuropeEcuadorEgyptEl SalvadorEnglandEritreaEthiopiaEuropeFijiFranceGermanyGhanaGreeceGrenadaGuatemalaGuyanaHaitiHondurasHong KongHungaryIndiaIndonesiaIranIraqIrelandIsraelItalyJamaicaJapanJordanKazakhstanKenyaKoreaKuwaitLaosLatin AmericaLatviaLebanonLiberiaLithuaniaMalaysiaMexicoMicronesiaMiddle AfricaMoldovaMoroccoNepalNetherlandsNicaraguaNigeriaNorth AmericaNorth MacedoniaNorthern AfricaNorthern EuropeNorwayOceaniaPakistanPanamaPeruPhilippinesPolandPortugalRomaniaRussiaSaudi ArabiaScotlandSenegalSerbiaSierra LeoneSingaporeSomaliaSouth AfricaSouth AmericaSouth Central AsiaSouth Eastern AsiaSouthern EuropeSpainSri LankaSt. Vincent and the GrenadinesSudanSwedenSwitzerlandSyriaTaiwanThailandTrinidad and TobagoTurkeyUgandaUkraineUruguayUzbekistanVenezuelaVietnamWest IndiesWestern AfricaWestern AsiaWestern EuropeYemenZaireZimbabweAzores
Disability Age 18 to 34
Income
Poverty
Unemployment
Labor Participation
Family Structure
Vehicle Availability
Education Level
Disability

Disability Age 18 to 34 Comparison

Arapaho

Immigrants from Nicaragua

Tragic
Exceptional
7.1%
DISABILITY AGE 18 TO 34
1.1/ 100
METRIC RATING
240th/ 347
METRIC RANK
5.7%
DISABILITY AGE 18 TO 34
100.0/ 100
METRIC RATING
22nd/ 347
METRIC RANK

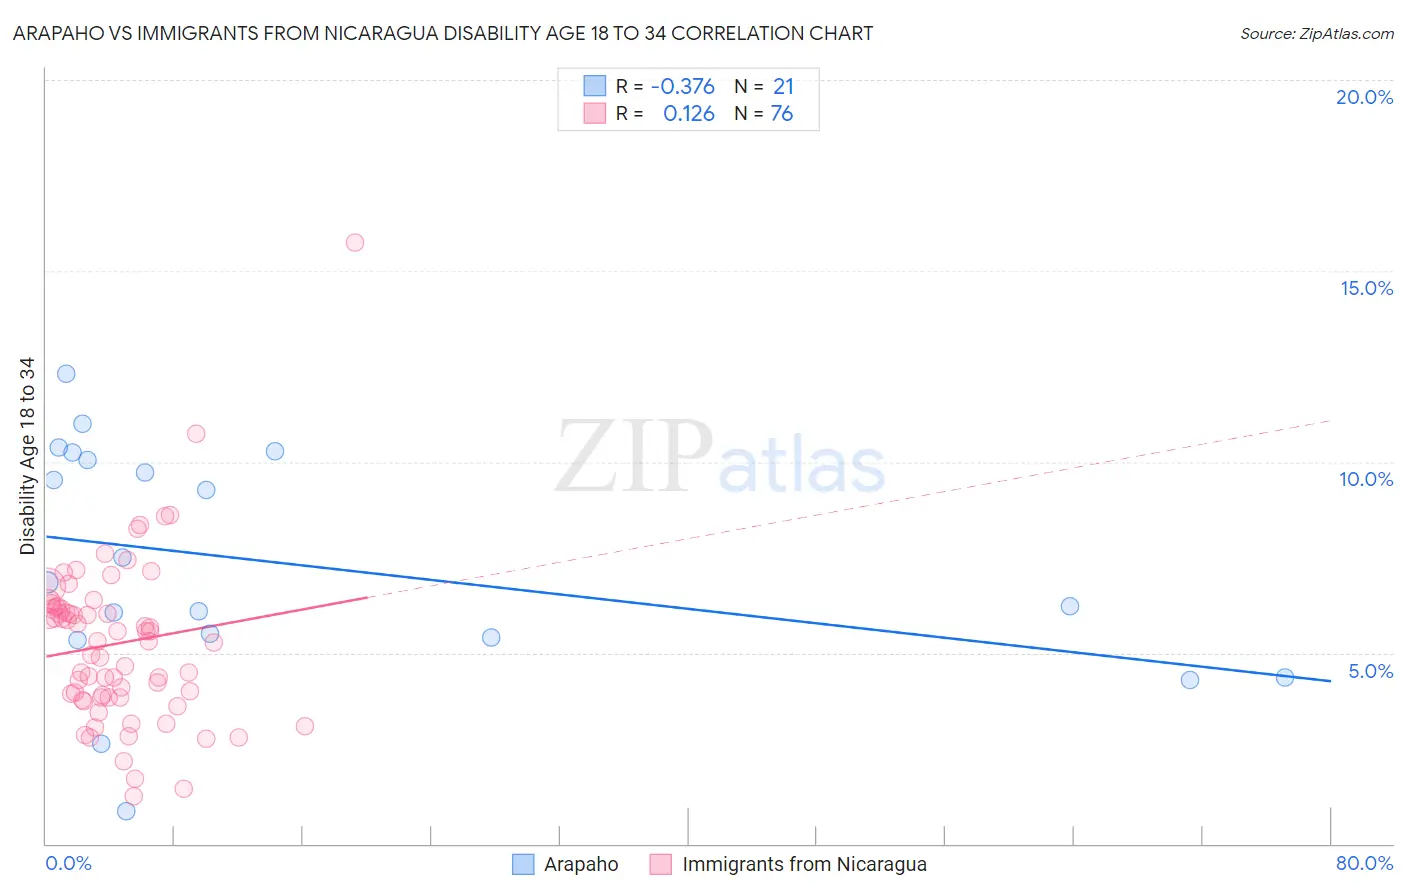
Arapaho vs Immigrants from Nicaragua Disability Age 18 to 34 Correlation Chart

The statistical analysis conducted on geographies consisting of 29,757,302 people shows a mild negative correlation between the proportion of Arapaho and percentage of population with a disability between the ages 18 and 35 in the United States with a correlation coefficient (R) of -0.376 and weighted average of 7.1%. Similarly, the statistical analysis conducted on geographies consisting of 236,200,719 people shows a poor positive correlation between the proportion of Immigrants from Nicaragua and percentage of population with a disability between the ages 18 and 35 in the United States with a correlation coefficient (R) of 0.126 and weighted average of 5.7%, a difference of 25.4%.
Arapaho vs Immigrants from Nicaragua Disability Age 18 to 34

Disability Age 18 to 34 Correlation Summary

MeasurementArapahoImmigrants from Nicaragua
Minimum0.84%1.3%
Maximum12.3%15.7%
Range11.5%14.5%
Mean7.3%5.2%
Median6.8%5.3%
Interquartile 25% (IQ1)5.4%3.8%
Interquartile 75% (IQ3)10.2%6.2%
Interquartile Range (IQR)4.8%2.3%
Standard Deviation (Sample)3.0%2.2%
Standard Deviation (Population)3.0%2.2%

Similar Demographics by Disability Age 18 to 34

Demographics Similar to Arapaho by Disability Age 18 to 34

In terms of disability age 18 to 34, the demographic groups most similar to Arapaho are Nepalese (7.1%, a difference of 0.0%), Immigrants from Congo (7.1%, a difference of 0.050%), Icelander (7.1%, a difference of 0.11%), Italian (7.1%, a difference of 0.12%), and Marshallese (7.1%, a difference of 0.23%).
DemographicsRating | RankDisability Age 18 to 34
New Zealanders
2.7
/100
|
#233
Tragic
7.0%
Alsatians
2.1
/100
|
#234
Tragic
7.0%
Sub-Saharan Africans
1.7
/100
|
#235
Tragic
7.1%
Liberians
1.5
/100
|
#236
Tragic
7.1%
Austrians
1.3
/100
|
#237
Tragic
7.1%
Marshallese
1.3
/100
|
#238
Tragic
7.1%
Italians
1.2
/100
|
#239
Tragic
7.1%
Arapaho
1.1
/100
|
#240
Tragic
7.1%
Nepalese
1.1
/100
|
#241
Tragic
7.1%
Immigrants | Congo
1.1
/100
|
#242
Tragic
7.1%
Icelanders
1.0
/100
|
#243
Tragic
7.1%
Immigrants | Zaire
0.9
/100
|
#244
Tragic
7.1%
Hungarians
0.9
/100
|
#245
Tragic
7.1%
Immigrants | Liberia
0.8
/100
|
#246
Tragic
7.1%
Yugoslavians
0.8
/100
|
#247
Tragic
7.2%

Demographics Similar to Immigrants from Nicaragua by Disability Age 18 to 34

In terms of disability age 18 to 34, the demographic groups most similar to Immigrants from Nicaragua are Immigrants from South Central Asia (5.7%, a difference of 0.070%), Cuban (5.7%, a difference of 0.60%), Immigrants from Bangladesh (5.6%, a difference of 0.65%), Immigrants from Argentina (5.7%, a difference of 0.71%), and Immigrants from Singapore (5.7%, a difference of 0.74%).
DemographicsRating | RankDisability Age 18 to 34
Immigrants | India
100.0
/100
|
#15
Exceptional
5.6%
Immigrants | Israel
100.0
/100
|
#16
Exceptional
5.6%
Immigrants | Eastern Asia
100.0
/100
|
#17
Exceptional
5.6%
Immigrants | Bolivia
100.0
/100
|
#18
Exceptional
5.6%
Thais
100.0
/100
|
#19
Exceptional
5.6%
Immigrants | Bangladesh
100.0
/100
|
#20
Exceptional
5.6%
Immigrants | South Central Asia
100.0
/100
|
#21
Exceptional
5.7%
Immigrants | Nicaragua
100.0
/100
|
#22
Exceptional
5.7%
Cubans
100.0
/100
|
#23
Exceptional
5.7%
Immigrants | Argentina
100.0
/100
|
#24
Exceptional
5.7%
Immigrants | Singapore
100.0
/100
|
#25
Exceptional
5.7%
Immigrants | Colombia
100.0
/100
|
#26
Exceptional
5.7%
Immigrants | Venezuela
99.9
/100
|
#27
Exceptional
5.7%
Soviet Union
99.9
/100
|
#28
Exceptional
5.7%
Immigrants | Ecuador
99.9
/100
|
#29
Exceptional
5.7%