American vs Immigrants from Bulgaria Disability Age 35 to 64
COMPARE
American
Immigrants from Bulgaria
Disability Age 35 to 64
Disability Age 35 to 64 Comparison
Americans
Immigrants from Bulgaria
13.9%
DISABILITY AGE 35 TO 64
0.0/ 100
METRIC RATING
305th/ 347
METRIC RANK
9.8%
DISABILITY AGE 35 TO 64
99.8/ 100
METRIC RATING
52nd/ 347
METRIC RANK
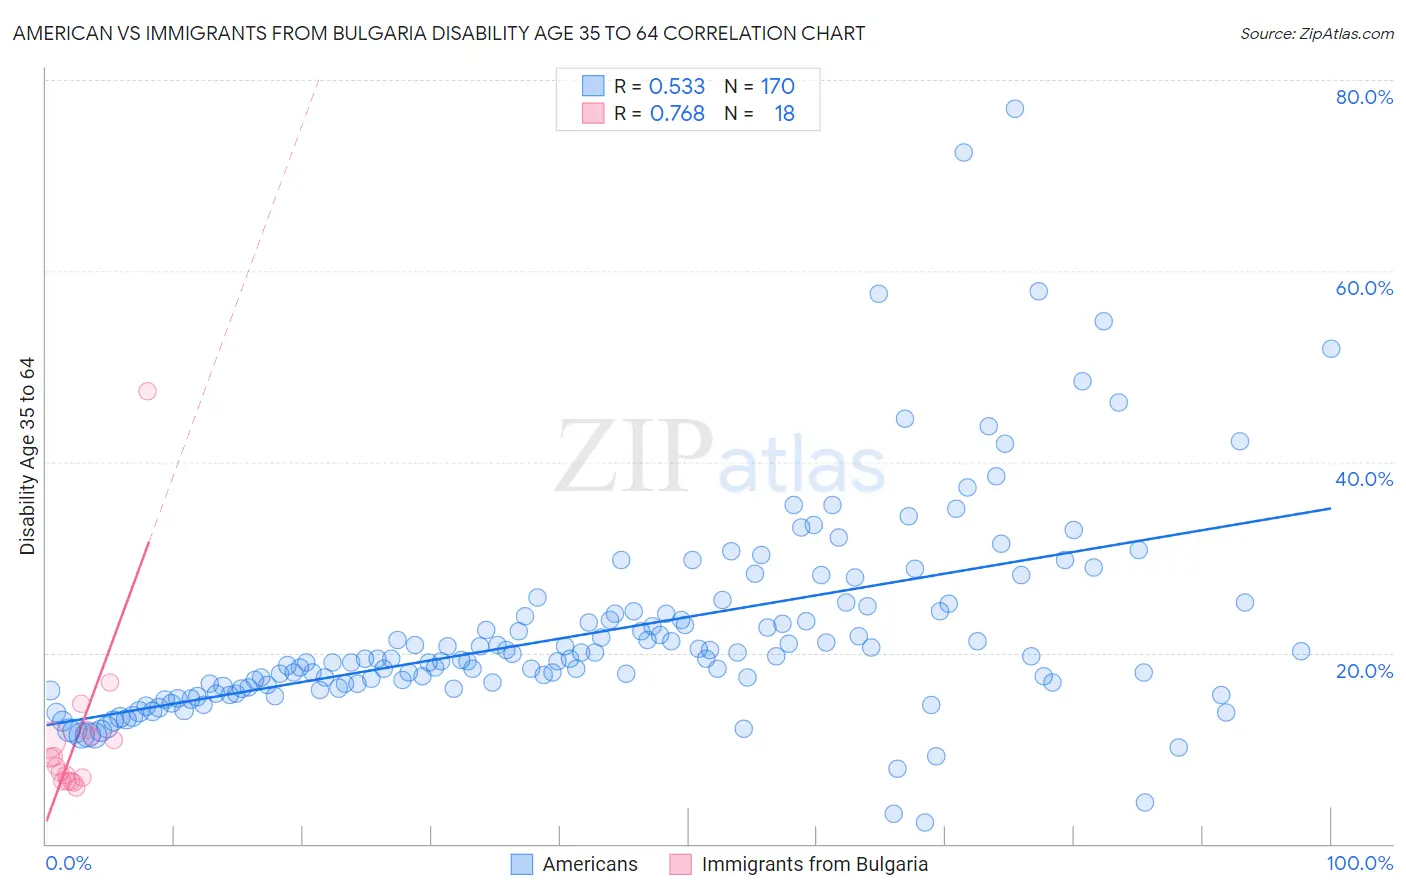
American vs Immigrants from Bulgaria Disability Age 35 to 64 Correlation Chart
The statistical analysis conducted on geographies consisting of 580,759,751 people shows a substantial positive correlation between the proportion of Americans and percentage of population with a disability between the ages 34 and 64 in the United States with a correlation coefficient (R) of 0.533 and weighted average of 13.9%. Similarly, the statistical analysis conducted on geographies consisting of 172,533,865 people shows a strong positive correlation between the proportion of Immigrants from Bulgaria and percentage of population with a disability between the ages 34 and 64 in the United States with a correlation coefficient (R) of 0.768 and weighted average of 9.8%, a difference of 41.4%.
Disability Age 35 to 64 Correlation Summary
| Measurement | American | Immigrants from Bulgaria |
| Minimum | 2.3% | 5.9% |
| Maximum | 76.9% | 47.4% |
| Range | 74.7% | 41.4% |
| Mean | 22.2% | 11.3% |
| Median | 19.4% | 8.6% |
| Interquartile 25% (IQ1) | 16.3% | 6.5% |
| Interquartile 75% (IQ3) | 24.3% | 11.2% |
| Interquartile Range (IQR) | 8.0% | 4.7% |
| Standard Deviation (Sample) | 11.0% | 9.5% |
| Standard Deviation (Population) | 11.0% | 9.2% |
Similar Demographics by Disability Age 35 to 64
Demographics Similar to Americans by Disability Age 35 to 64
In terms of disability age 35 to 64, the demographic groups most similar to Americans are Hopi (13.9%, a difference of 0.38%), Sioux (13.9%, a difference of 0.41%), Aleut (13.8%, a difference of 0.59%), Immigrants from Yemen (14.0%, a difference of 0.87%), and Blackfeet (14.1%, a difference of 1.0%).
| Demographics | Rating | Rank | Disability Age 35 to 64 |
| Cheyenne | 0.0 /100 | #298 | Tragic 13.6% |
| Spanish Americans | 0.0 /100 | #299 | Tragic 13.7% |
| Delaware | 0.0 /100 | #300 | Tragic 13.7% |
| French American Indians | 0.0 /100 | #301 | Tragic 13.7% |
| Aleuts | 0.0 /100 | #302 | Tragic 13.8% |
| Sioux | 0.0 /100 | #303 | Tragic 13.9% |
| Hopi | 0.0 /100 | #304 | Tragic 13.9% |
| Americans | 0.0 /100 | #305 | Tragic 13.9% |
| Immigrants | Yemen | 0.0 /100 | #306 | Tragic 14.0% |
| Blackfeet | 0.0 /100 | #307 | Tragic 14.1% |
| Inupiat | 0.0 /100 | #308 | Tragic 14.1% |
| Cree | 0.0 /100 | #309 | Tragic 14.1% |
| Cape Verdeans | 0.0 /100 | #310 | Tragic 14.1% |
| Immigrants | Azores | 0.0 /100 | #311 | Tragic 14.3% |
| Paiute | 0.0 /100 | #312 | Tragic 14.3% |
Demographics Similar to Immigrants from Bulgaria by Disability Age 35 to 64
In terms of disability age 35 to 64, the demographic groups most similar to Immigrants from Bulgaria are Bhutanese (9.8%, a difference of 0.010%), Taiwanese (9.8%, a difference of 0.060%), Immigrants from Russia (9.8%, a difference of 0.090%), Paraguayan (9.8%, a difference of 0.10%), and Peruvian (9.9%, a difference of 0.16%).
| Demographics | Rating | Rank | Disability Age 35 to 64 |
| Immigrants | Peru | 99.9 /100 | #45 | Exceptional 9.8% |
| Cambodians | 99.8 /100 | #46 | Exceptional 9.8% |
| Immigrants | Belgium | 99.8 /100 | #47 | Exceptional 9.8% |
| Immigrants | Serbia | 99.8 /100 | #48 | Exceptional 9.8% |
| Immigrants | Greece | 99.8 /100 | #49 | Exceptional 9.8% |
| Paraguayans | 99.8 /100 | #50 | Exceptional 9.8% |
| Bhutanese | 99.8 /100 | #51 | Exceptional 9.8% |
| Immigrants | Bulgaria | 99.8 /100 | #52 | Exceptional 9.8% |
| Taiwanese | 99.8 /100 | #53 | Exceptional 9.8% |
| Immigrants | Russia | 99.8 /100 | #54 | Exceptional 9.8% |
| Peruvians | 99.8 /100 | #55 | Exceptional 9.9% |
| South Americans | 99.8 /100 | #56 | Exceptional 9.9% |
| Colombians | 99.8 /100 | #57 | Exceptional 9.9% |
| Armenians | 99.8 /100 | #58 | Exceptional 9.9% |
| Immigrants | Sweden | 99.7 /100 | #59 | Exceptional 9.9% |