American vs Haitian Disability Age 18 to 34
COMPARE
American
Haitian
Disability Age 18 to 34
Disability Age 18 to 34 Comparison
Americans
Haitians
8.0%
DISABILITY AGE 18 TO 34
0.0/ 100
METRIC RATING
315th/ 347
METRIC RANK
6.0%
DISABILITY AGE 18 TO 34
99.2/ 100
METRIC RATING
74th/ 347
METRIC RANK
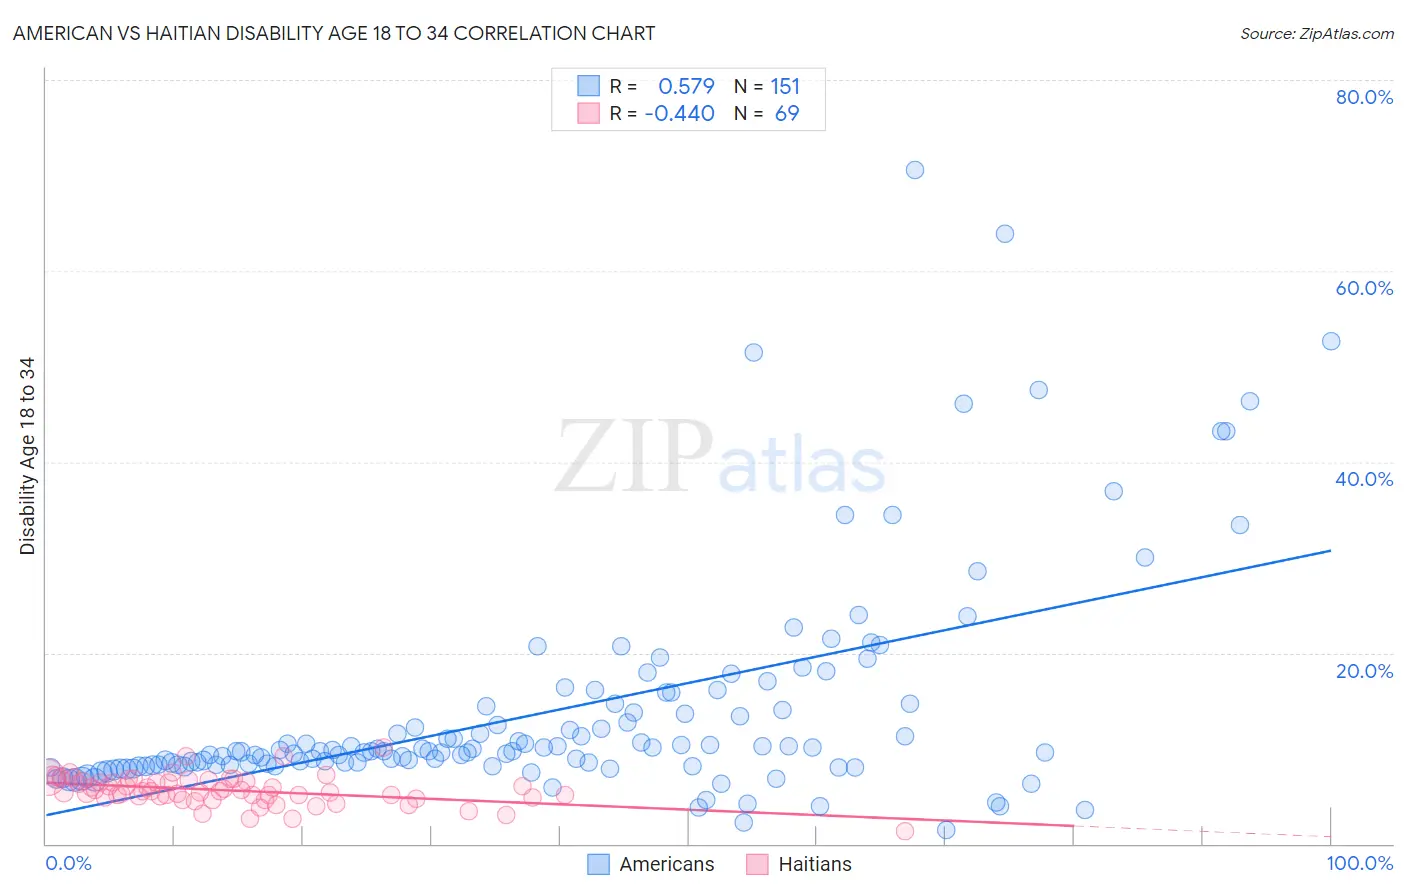
American vs Haitian Disability Age 18 to 34 Correlation Chart
The statistical analysis conducted on geographies consisting of 574,583,568 people shows a substantial positive correlation between the proportion of Americans and percentage of population with a disability between the ages 18 and 35 in the United States with a correlation coefficient (R) of 0.579 and weighted average of 8.0%. Similarly, the statistical analysis conducted on geographies consisting of 287,604,782 people shows a moderate negative correlation between the proportion of Haitians and percentage of population with a disability between the ages 18 and 35 in the United States with a correlation coefficient (R) of -0.440 and weighted average of 6.0%, a difference of 32.2%.
Disability Age 18 to 34 Correlation Summary
| Measurement | American | Haitian |
| Minimum | 1.5% | 1.4% |
| Maximum | 70.5% | 10.0% |
| Range | 69.0% | 8.7% |
| Mean | 13.8% | 5.6% |
| Median | 9.7% | 5.5% |
| Interquartile 25% (IQ1) | 8.2% | 4.9% |
| Interquartile 75% (IQ3) | 14.4% | 6.6% |
| Interquartile Range (IQR) | 6.2% | 1.8% |
| Standard Deviation (Sample) | 11.5% | 1.5% |
| Standard Deviation (Population) | 11.5% | 1.5% |
Similar Demographics by Disability Age 18 to 34
Demographics Similar to Americans by Disability Age 18 to 34
In terms of disability age 18 to 34, the demographic groups most similar to Americans are Puerto Rican (8.0%, a difference of 0.26%), Colville (7.9%, a difference of 0.72%), Hmong (8.1%, a difference of 0.72%), French Canadian (8.1%, a difference of 1.1%), and Iroquois (7.9%, a difference of 1.2%).
| Demographics | Rating | Rank | Disability Age 18 to 34 |
| Pennsylvania Germans | 0.0 /100 | #308 | Tragic 7.8% |
| Alaska Natives | 0.0 /100 | #309 | Tragic 7.8% |
| Finns | 0.0 /100 | #310 | Tragic 7.8% |
| French | 0.0 /100 | #311 | Tragic 7.9% |
| Spanish Americans | 0.0 /100 | #312 | Tragic 7.9% |
| Iroquois | 0.0 /100 | #313 | Tragic 7.9% |
| Colville | 0.0 /100 | #314 | Tragic 7.9% |
| Americans | 0.0 /100 | #315 | Tragic 8.0% |
| Puerto Ricans | 0.0 /100 | #316 | Tragic 8.0% |
| Hmong | 0.0 /100 | #317 | Tragic 8.1% |
| French Canadians | 0.0 /100 | #318 | Tragic 8.1% |
| Aleuts | 0.0 /100 | #319 | Tragic 8.1% |
| Navajo | 0.0 /100 | #320 | Tragic 8.1% |
| Blackfeet | 0.0 /100 | #321 | Tragic 8.1% |
| Cree | 0.0 /100 | #322 | Tragic 8.1% |
Demographics Similar to Haitians by Disability Age 18 to 34
In terms of disability age 18 to 34, the demographic groups most similar to Haitians are Immigrants from Lebanon (6.0%, a difference of 0.090%), Cypriot (6.0%, a difference of 0.090%), Immigrants from Japan (6.0%, a difference of 0.21%), Immigrants from Turkey (6.1%, a difference of 0.29%), and Immigrants from Greece (6.0%, a difference of 0.48%).
| Demographics | Rating | Rank | Disability Age 18 to 34 |
| Immigrants | North Macedonia | 99.5 /100 | #67 | Exceptional 6.0% |
| Immigrants | Poland | 99.5 /100 | #68 | Exceptional 6.0% |
| Immigrants | West Indies | 99.4 /100 | #69 | Exceptional 6.0% |
| Immigrants | Greece | 99.4 /100 | #70 | Exceptional 6.0% |
| Immigrants | Japan | 99.3 /100 | #71 | Exceptional 6.0% |
| Immigrants | Lebanon | 99.2 /100 | #72 | Exceptional 6.0% |
| Cypriots | 99.2 /100 | #73 | Exceptional 6.0% |
| Haitians | 99.2 /100 | #74 | Exceptional 6.0% |
| Immigrants | Turkey | 99.1 /100 | #75 | Exceptional 6.1% |
| Immigrants | Western Asia | 98.9 /100 | #76 | Exceptional 6.1% |
| Immigrants | Russia | 98.9 /100 | #77 | Exceptional 6.1% |
| Assyrians/Chaldeans/Syriacs | 98.9 /100 | #78 | Exceptional 6.1% |
| Afghans | 98.7 /100 | #79 | Exceptional 6.1% |
| Immigrants | Chile | 98.5 /100 | #80 | Exceptional 6.1% |
| Immigrants | Australia | 98.5 /100 | #81 | Exceptional 6.1% |